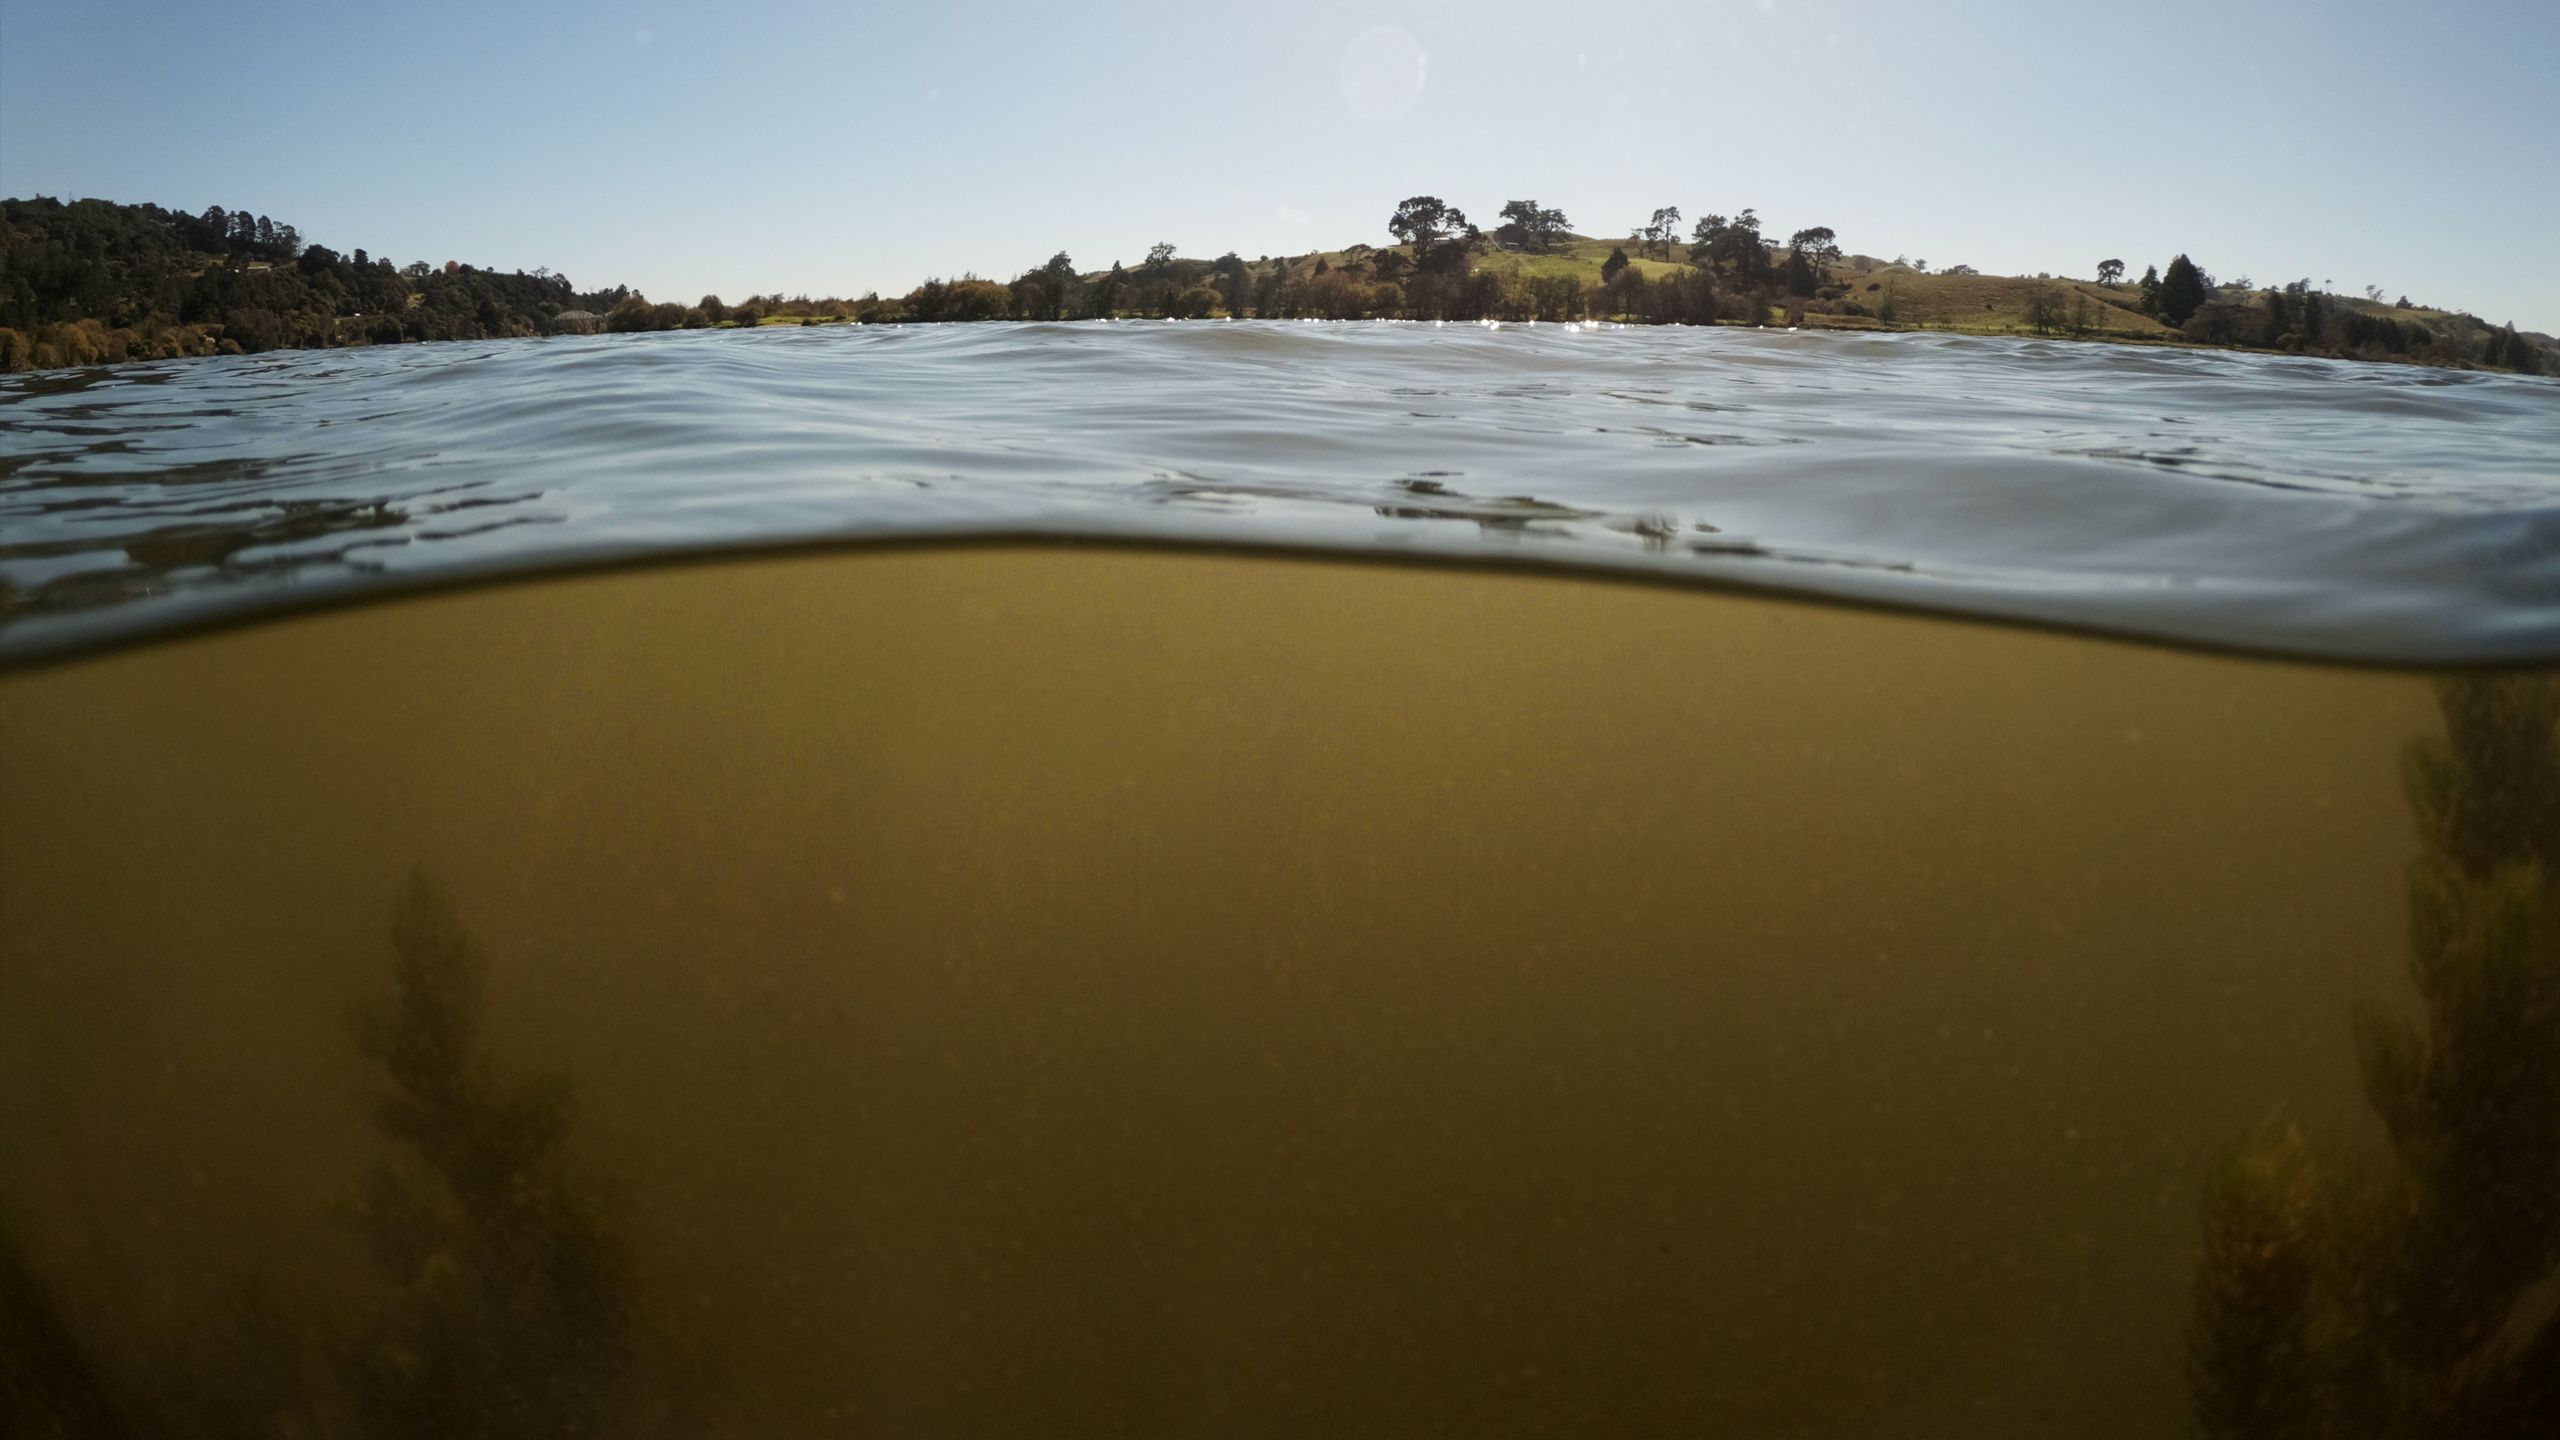
Shake a jar of water taken from the Tuakau Bridge end of the Waikato River, and a flurry of brown sediment levitates, like a snowglobe gone wrong.
It’s a far cry from the pristinely clear water at Taupō, where the river begins.
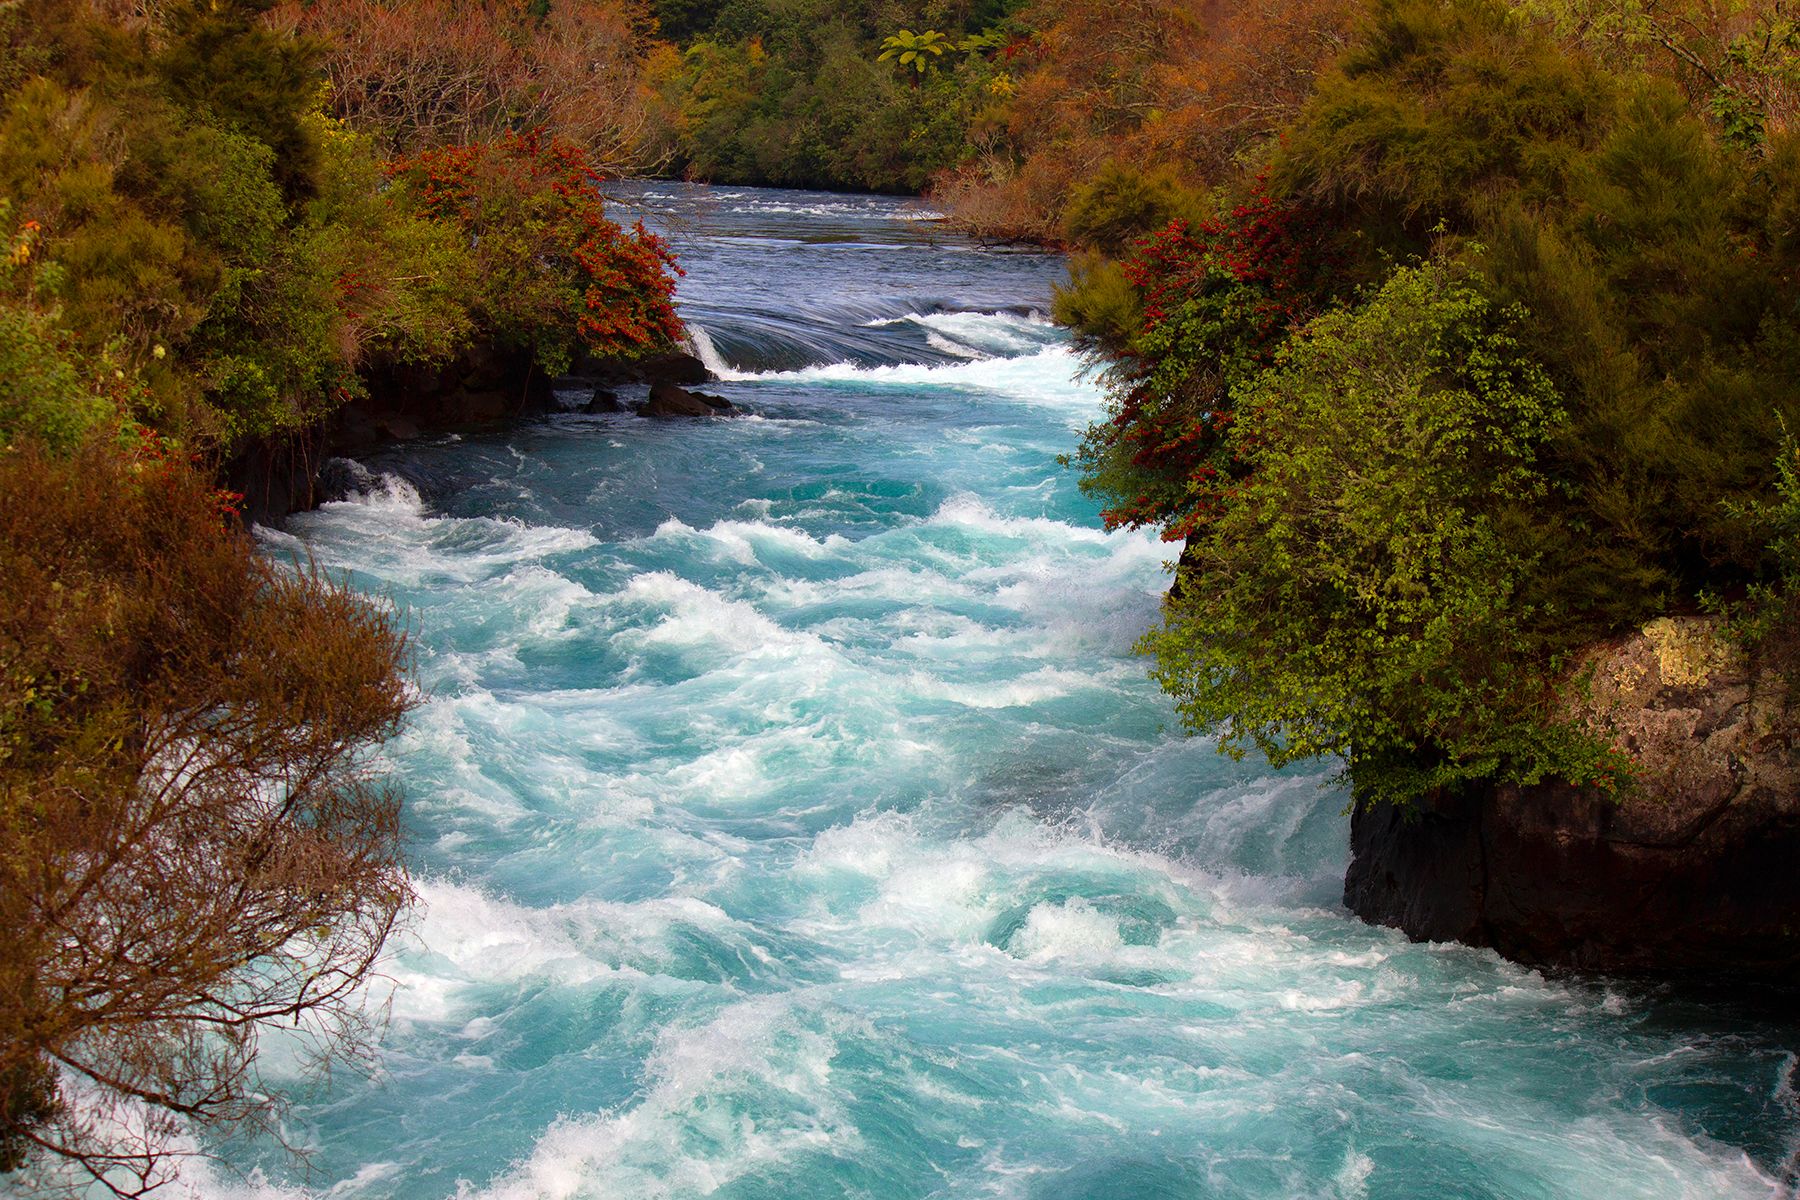
Water at Huka Falls, close to Lake Taupō, is crystal clear
Water at Huka Falls, close to Lake Taupō, is crystal clear
Dotted along the 425km of New Zealand’s longest river are towns, farms, dams, and outflows from sewage plants, dairy factories, meatworks and a pulp and paper mill. Each of these affect the state of the river.
By the time it nears its end at Tuakau Bridge tiny particles of dirt fill the water. “If you’re standing up to your waist, you might not be able to see your feet,” says Waikato Regional Council’s senior water scientist Bill Vant.
And it’s not just dirt in the river. Swimmers play Russian roulette with infection from faecal matter. Between 20 to 30 percent of the time, more than 50 of every 1000 people who use the spot are likely to fall ill.
Nitrogen levels at Tuakau Bridge are in the worst 50 percent of all monitored river sites and phosphorus levels in the worst 25 percent. Both of these nutrients contribute to excess plant growth, which can lead to toxic algae blooms.
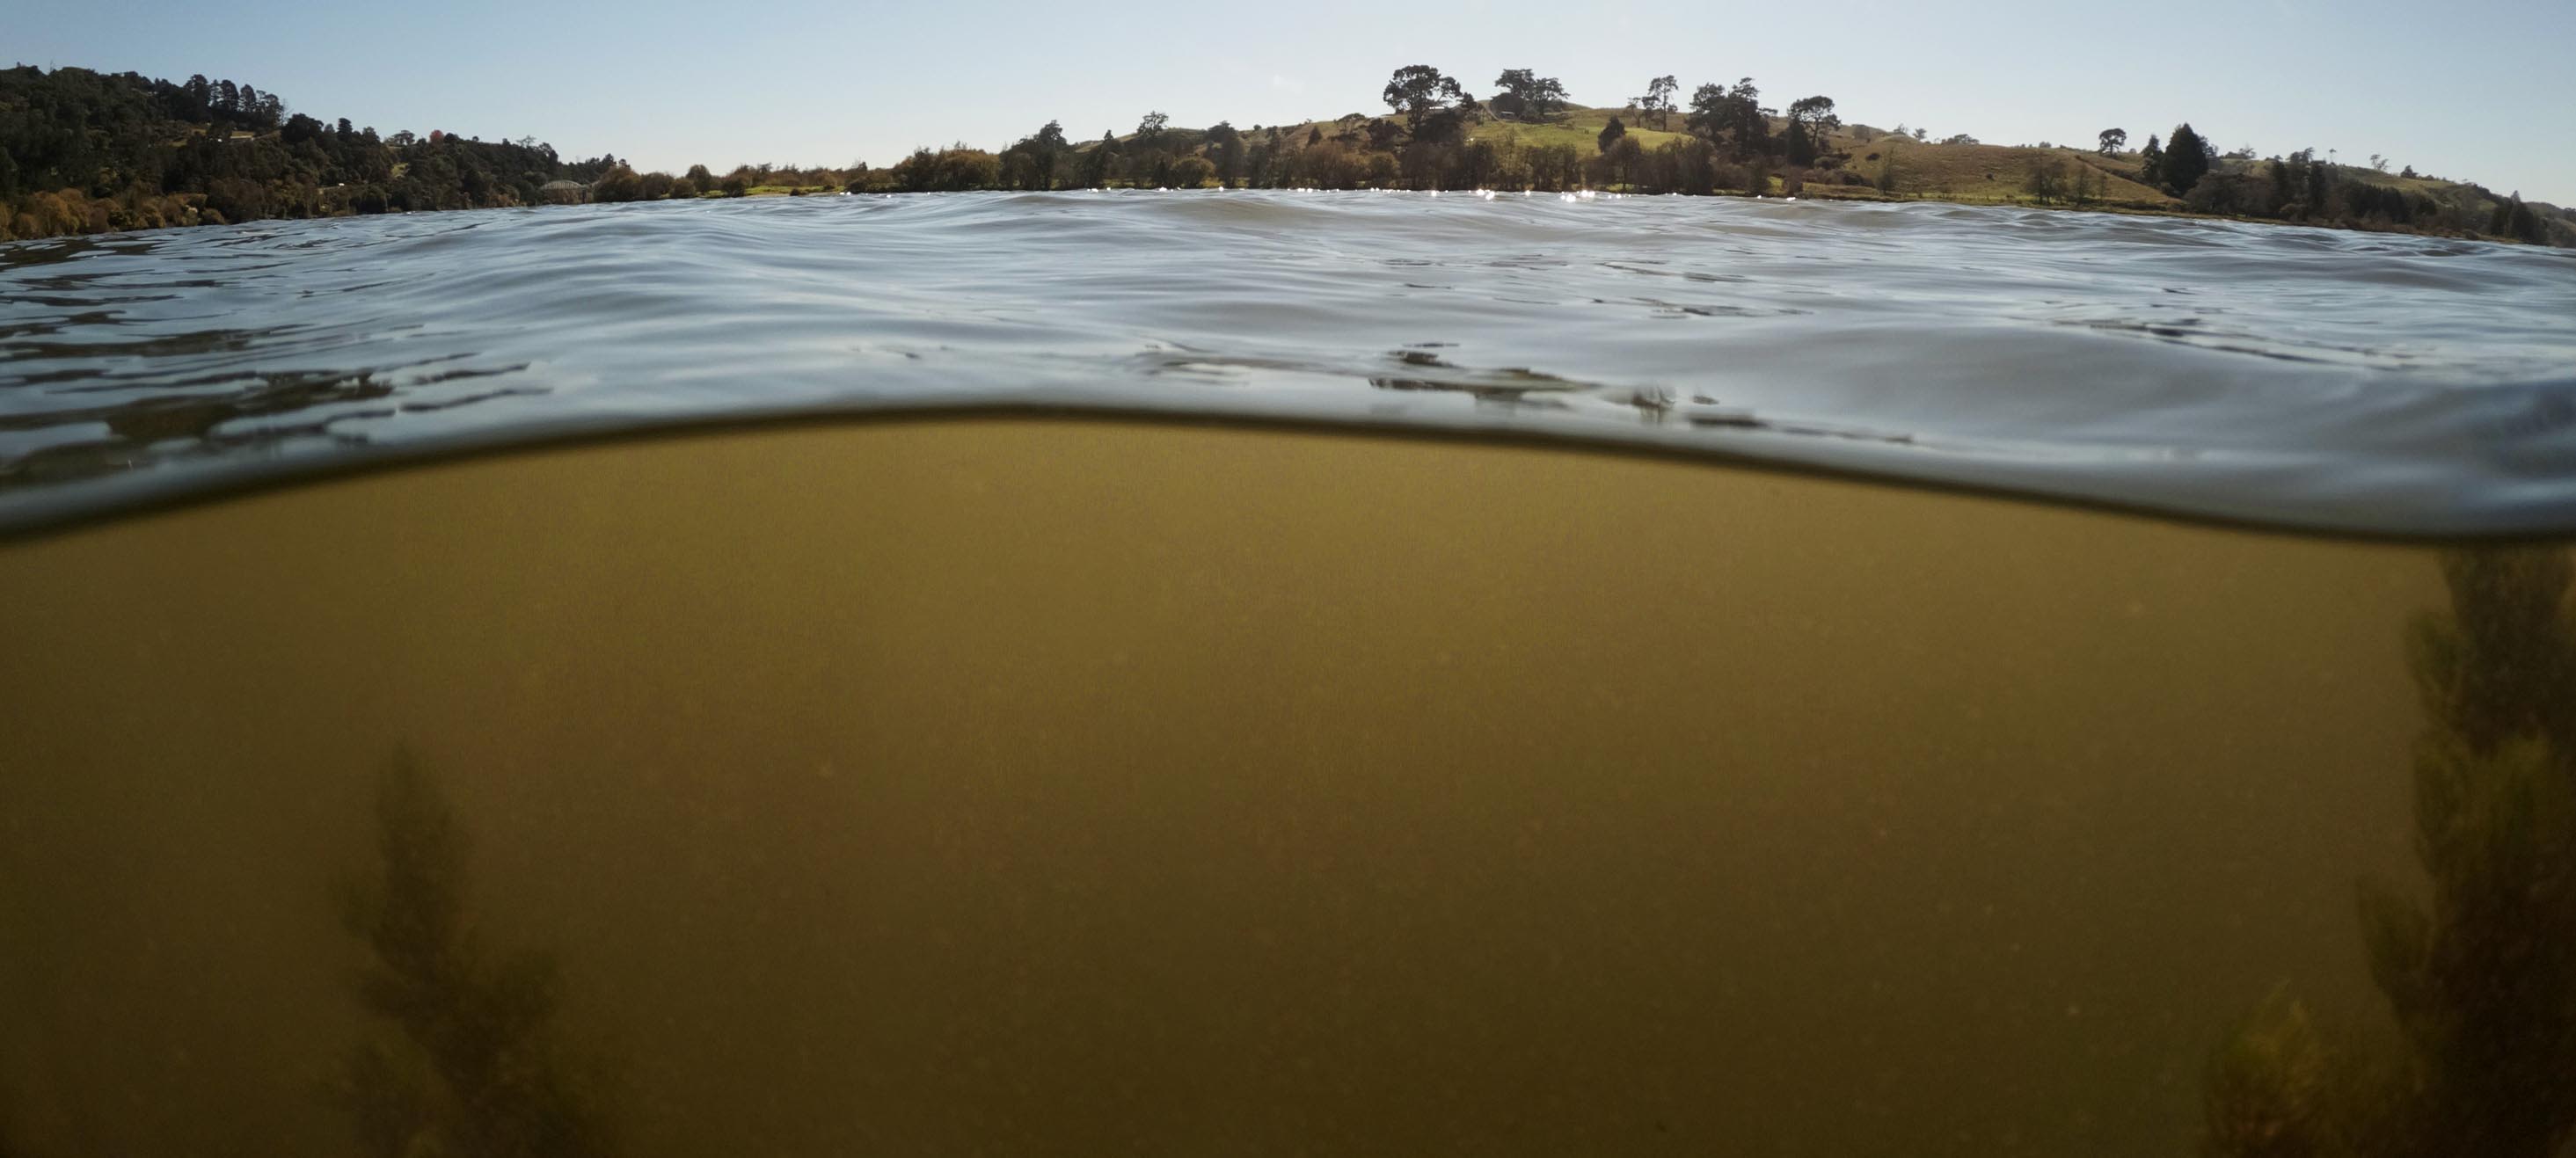
At Tuakau tiny particles of dirt fill the water.
At Tuakau tiny particles of dirt fill the water.
Who and what is polluting the river and what will it take to turn its health around?
The problems are entrenched. Rewind back to the Fifties and it was pollution pumped directly into the river that caused huge problems, says Vant, pulling out a yellowed report published by the Ministry of Works in 1956.
‘Dilution is the solution to pollution’, used to be the way people thought, he says, but this report indicates that by the mid-50s that approach was coming in for questioning.
Grainy black and white photos show scum-covered water and type-written passages describe “oil scum and turbid conditions” along the Hamilton river bank and bacteria counts at wildly high levels.
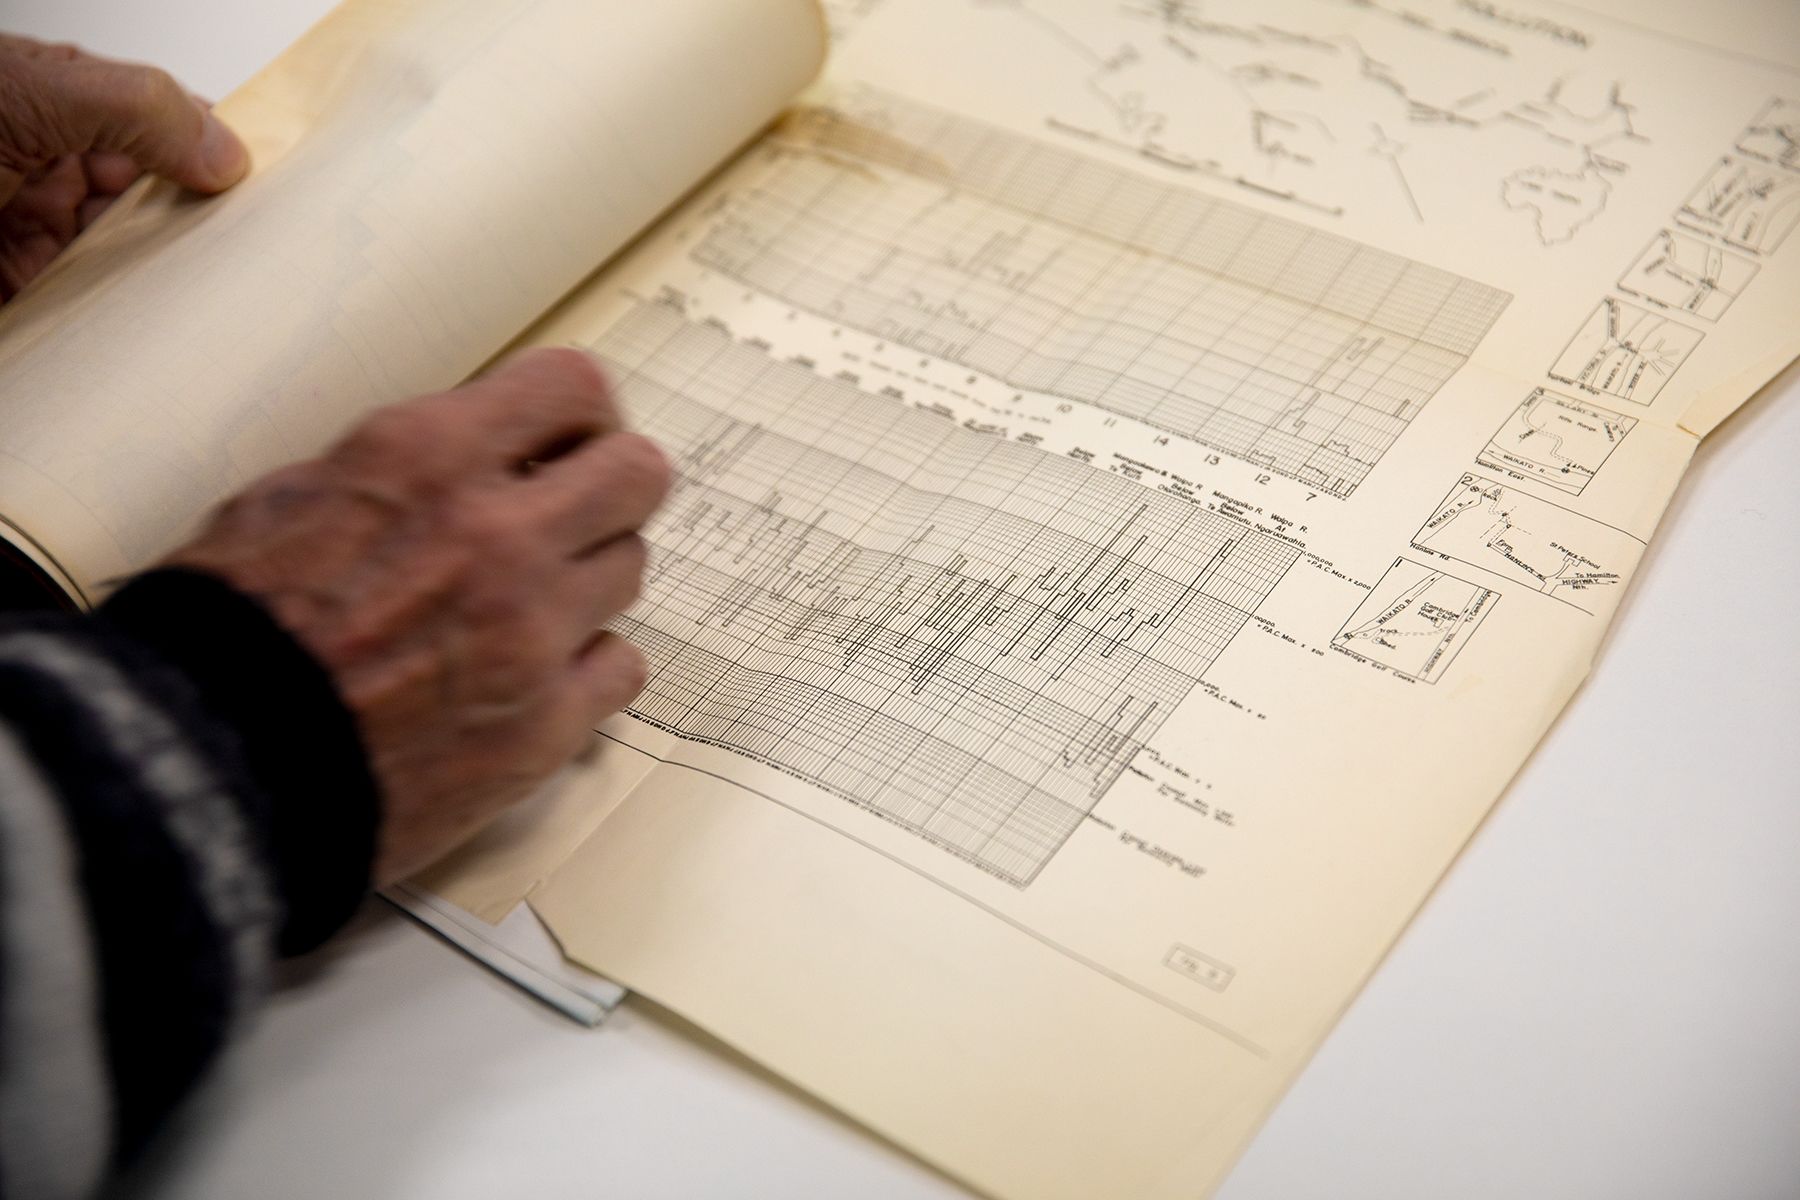
A 1956 Ministry of Work report shows the river was polluted by sewage and industry contaminants
A 1956 Ministry of Work report shows the river was polluted by sewage and industry contaminants
Problems at Hamilton worsened when the city’s septic tanks were quietly desludged into the river. “This was only done at night. We didn't want people to know about it,” Vant says.
Perhaps the most stomach-churning description is of the Mangapiko Stream, which at times contained more poo than water. “In summer the flow of effluent may be greater than the stream flow … Septic conditions can be seen for at least one mile downstream.”
These days, to pump waste directly into the river you usually require waste treatment, resource consents and monitoring. But we’re ruining the river in other ways.
The explosion in dairy farming has taken a toll, Vant says.
“The reality with any sort of farming on pasture in New Zealand is that we are able to leave our animals out on the paddocks all year long,” he says.
Our temperate climate means cattle aren’t housed in sheds.
“Which means that their wastes - the wees and poos - are not stored and collected; they just spread everywhere.”
A slow drool of contaminants like wee, poo, and fertiliser not used up by plants, can wash into streams, or the river, or seep into the ground and leach into soil, where it can make its way into the river.
The outflows from sewage plants, dairy factories, meatworks and the pulp and paper mill, is tiny compared to what seeps in from surrounding land.
“We've got much, much better at treating wastes from towns and from industries. We've become very, very good at that now. But our dairy cow population has increased markedly, particularly in the last 20 years,” Vant says.
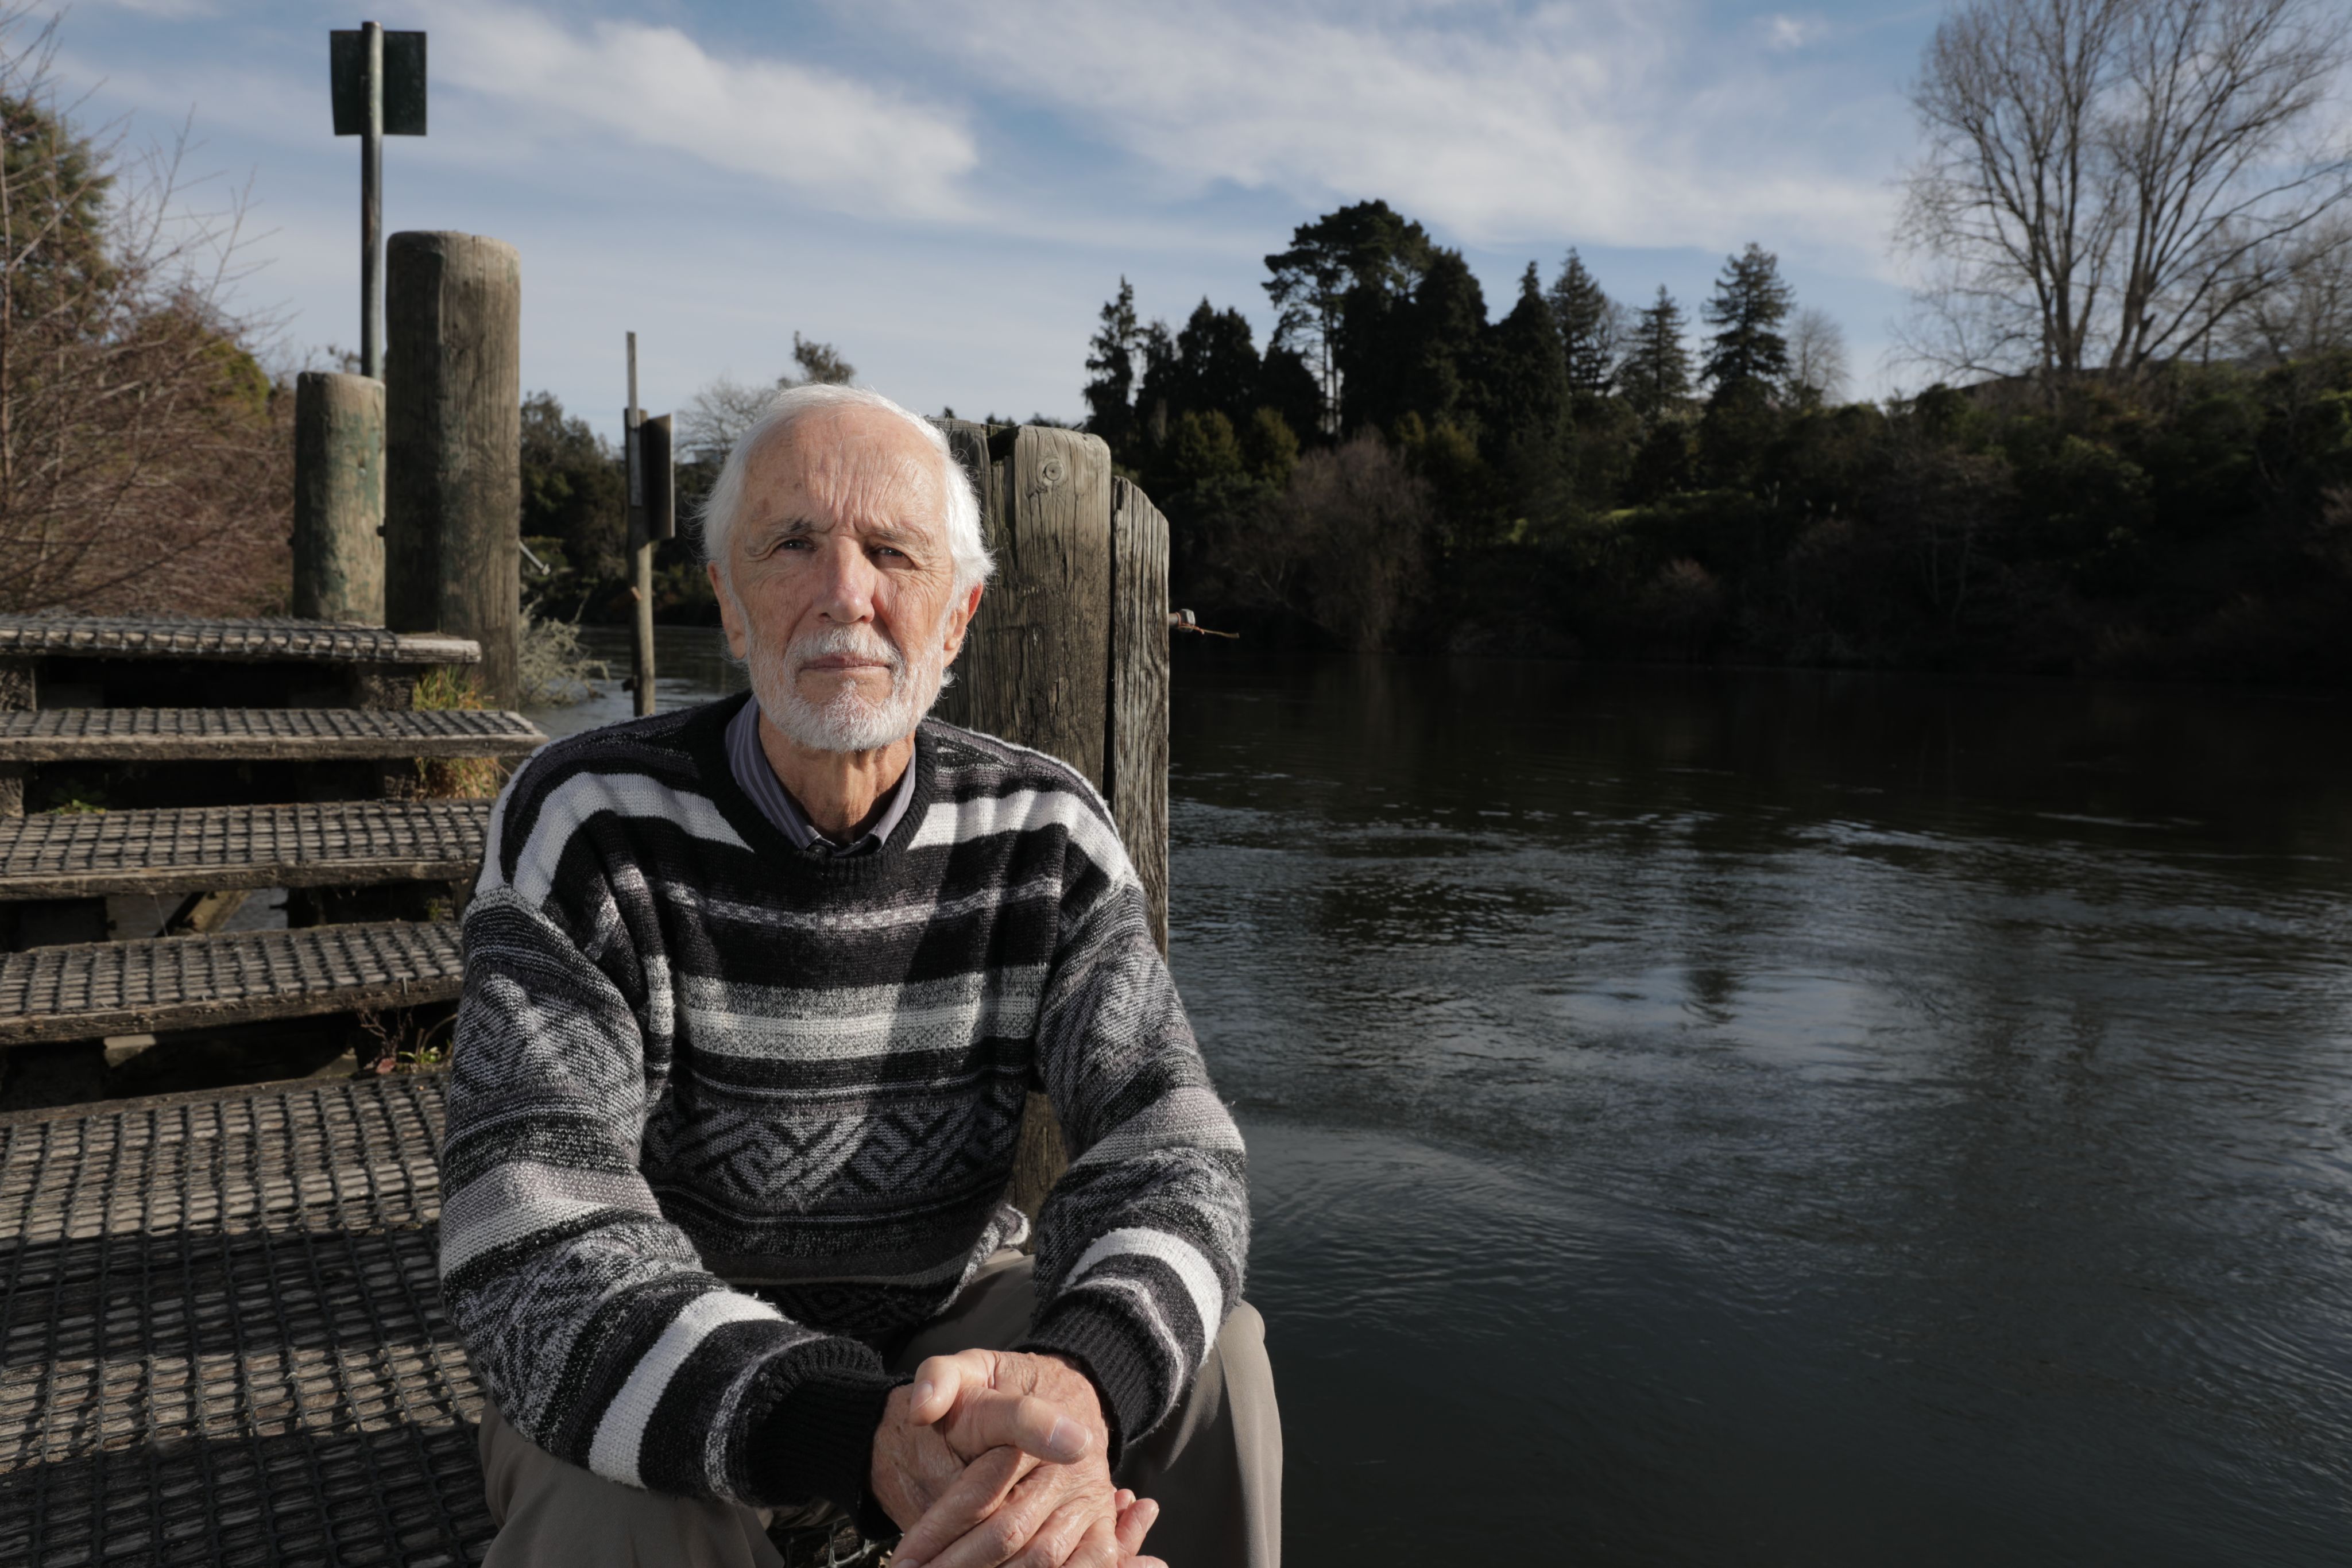
Bill Vant at a popular river swimming spot in Hamilton
Bill Vant at a popular river swimming spot in Hamilton
In fact, town and industrial wastewater only accounts for 6 percent of the nitrogen in the Waikato River, while 61 percent comes from the way the land is used, which is mainly pastoral farming.
Using information gleaned from consent monitoring and from river sampling, Vant has estimated how much nitrogen and phosphorus is entering the river, and where it’s coming from. He’s split this into three categories: background levels, land use (such as farming) and point sources (outflows from town sewage and industry).
Background levels are natural he says, and would have always been there. “Even in the cleanest part of New Zealand, which is, in places, a very clean place, the rainfall naturally contains levels of nitrogen and phosphorus.”
But by the time the river reaches the sea at Port Waikato - and makes its way into the taps of Aucklanders - more than 7000 tonnes of nitrogen and 367 tonnes of phosphorus have been added to the background levels each year, doubling the natural level of phosphorus in the river, and more than doubling the amount of nitrogen.

Waikato Regional Council has a plan to restore the entire length of the river so it is safe to swim in and take food from, but it’s unlikely to happen in many of our lifetimes. Turning the tide on the river’s health is expected to take 80 years.
The Council’s “proposed plan change 1” is an update to its Regional Plan. The plan change’s aim is to reduce nitrogen, phosphorus, sediment and bacteria entering the river.
It’s the first step in an 80-year journey described in the council’s plan as “costly and difficult” and having an “innovation gap,” meaning the solutions to reach the goal don’t yet exist, or aren’t economically feasible.
The plan change contains generous time frames - consultations began in 2016 but the river isn’t expected to be healthy enough to swim in or take food from until 2096. Yet, six years on the new rules haven’t made it off the starting block and some targets have been watered down along the way.
Now, instead of expecting water at Tuakau Bridge to have 41 percent less nitrogen and 62 percent less phosphorus, eight decades will apparently only buy us enough time to achieve 16 percent less nitrogen and 27 percent less phosphorus.
James Cook University research scientist Dr Adam Canning says taking 80 years to reduce levels to the new targets is pathetic. “It effectively means status quo, there is no change.”
He’s not the only one unhappy with the plan change. Since 2020, it’s been tied up in the Environment Court, with 24 appeals filed against it.
Fonterra’s appeal says the plan won’t achieve the short term goals, meaning future plans will be more stringent. The Waipā District Council opposes the shifting of a goal of a 10 percent improvement in water quality indicators in ten years, to a 20 percent improvement. Fertiliser company Ballance Agri-Nutrients is appealing some nitrogen caps and a ban on using fertiliser at certain times of the year. Federated Farmers’ appeal calls the rules “unclear and unworkable” and says efforts to clean the river need to be balanced with cost. The Pukekohe Vegetable Growers Association wants the plan to better reflect crop rotations and that operators often have crops on numerous properties. Even the Waikato Regional Council has lodged an appeal against its own proposed plan, mainly related to terms which may be too loose to enforce easily.
Until these are ruled on by the court, the plan change’s rules can’t be applied.
Tipa Mahuta (Waikato-Tainui) grew up in the shadow of Huntly’s smokestacks, her marae is next door to the powerstation. “I wouldn’t have a pepeha if it wasn’t for the river,” she says.
While the proposed plan change is tied up in appeals, Mahuta has her eyes on the river.
“The health and well being of the river was deteriorating, not getting better.”
But it can’t deteriorate. It’s enshrined in law that it mustn’t.
The Waikato River is unique - it has a custodian. A 2010 Waitangi Treaty settlement prompted the formation of the Waikato River Authority. It’s a co-governance arrangement with five representatives each from iwi and Crown. This Authority’s vision acts as the river’s custodian to “hold everybody to account for the well-being of the river,” says Mahuta, the Authority’s co-chair and iwi appointee.
The vision and strategy, Te Ture Whaimana o Te Awa o Waikato, set for the Waikato and Waipā rivers by the Authority states the rivers shouldn’t get any worse than what they are. Eventually the length of the river has to be safe for swimming and gathering food from.
Achieving the vision is enshrined in legislation, so the Waikato Regional Council has to ensure its rules will give effect to the vision.
That vision will impact farmers. Mahuta says the Authority isn’t anti-farming, but the sector has impacted water quality.
“They have to come some of the way to owning their effect. They weren’t gonna get away with it forever.”
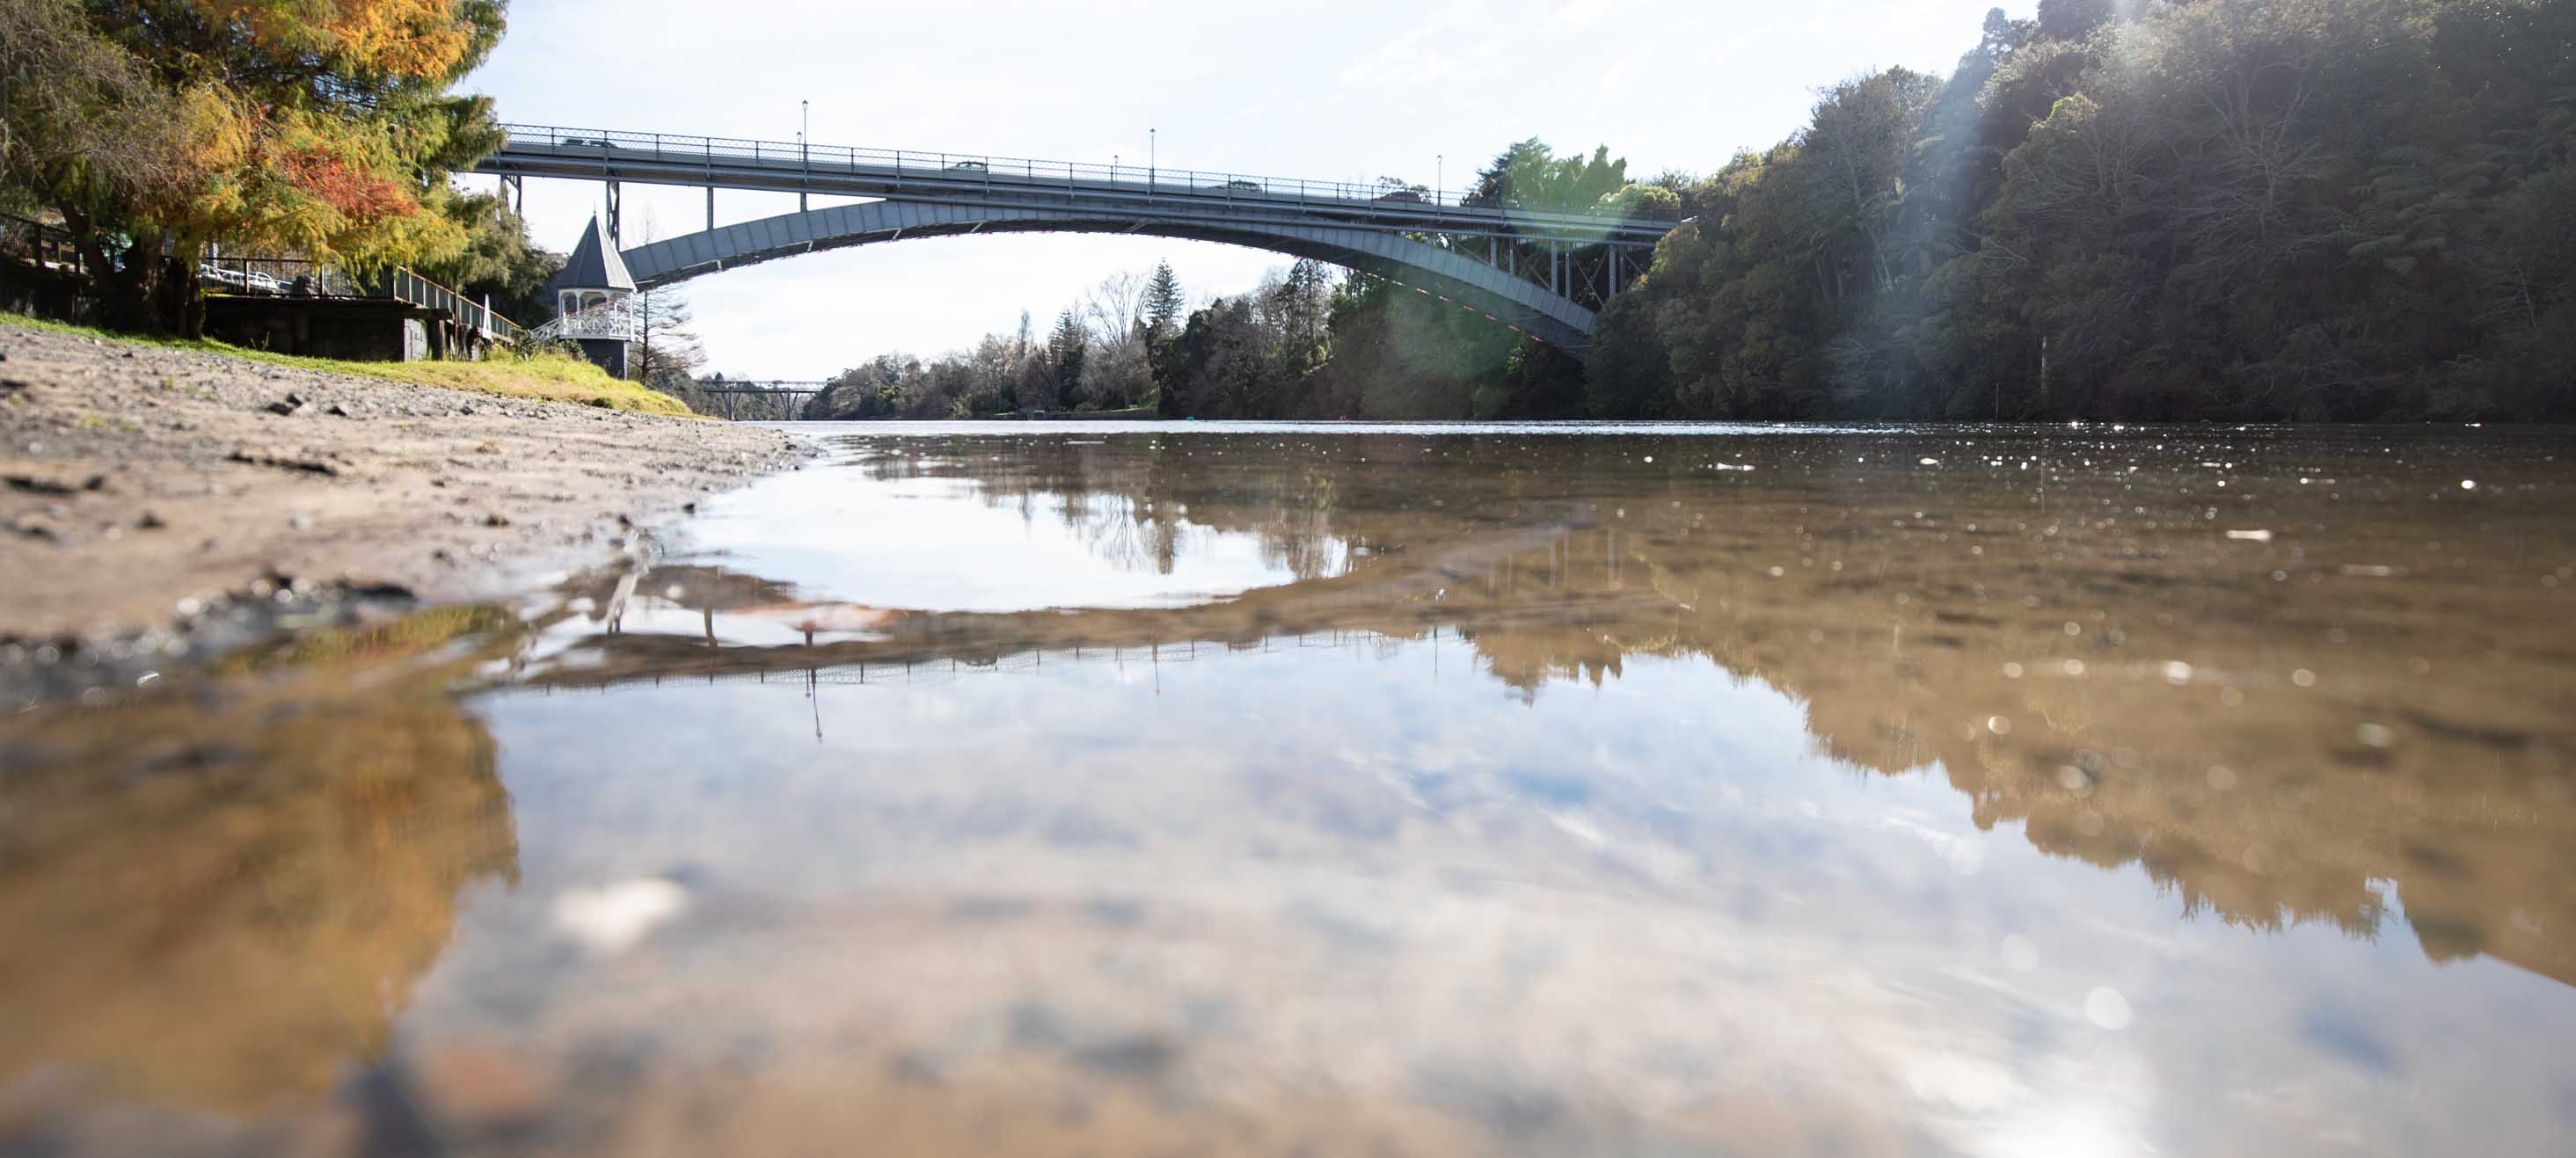
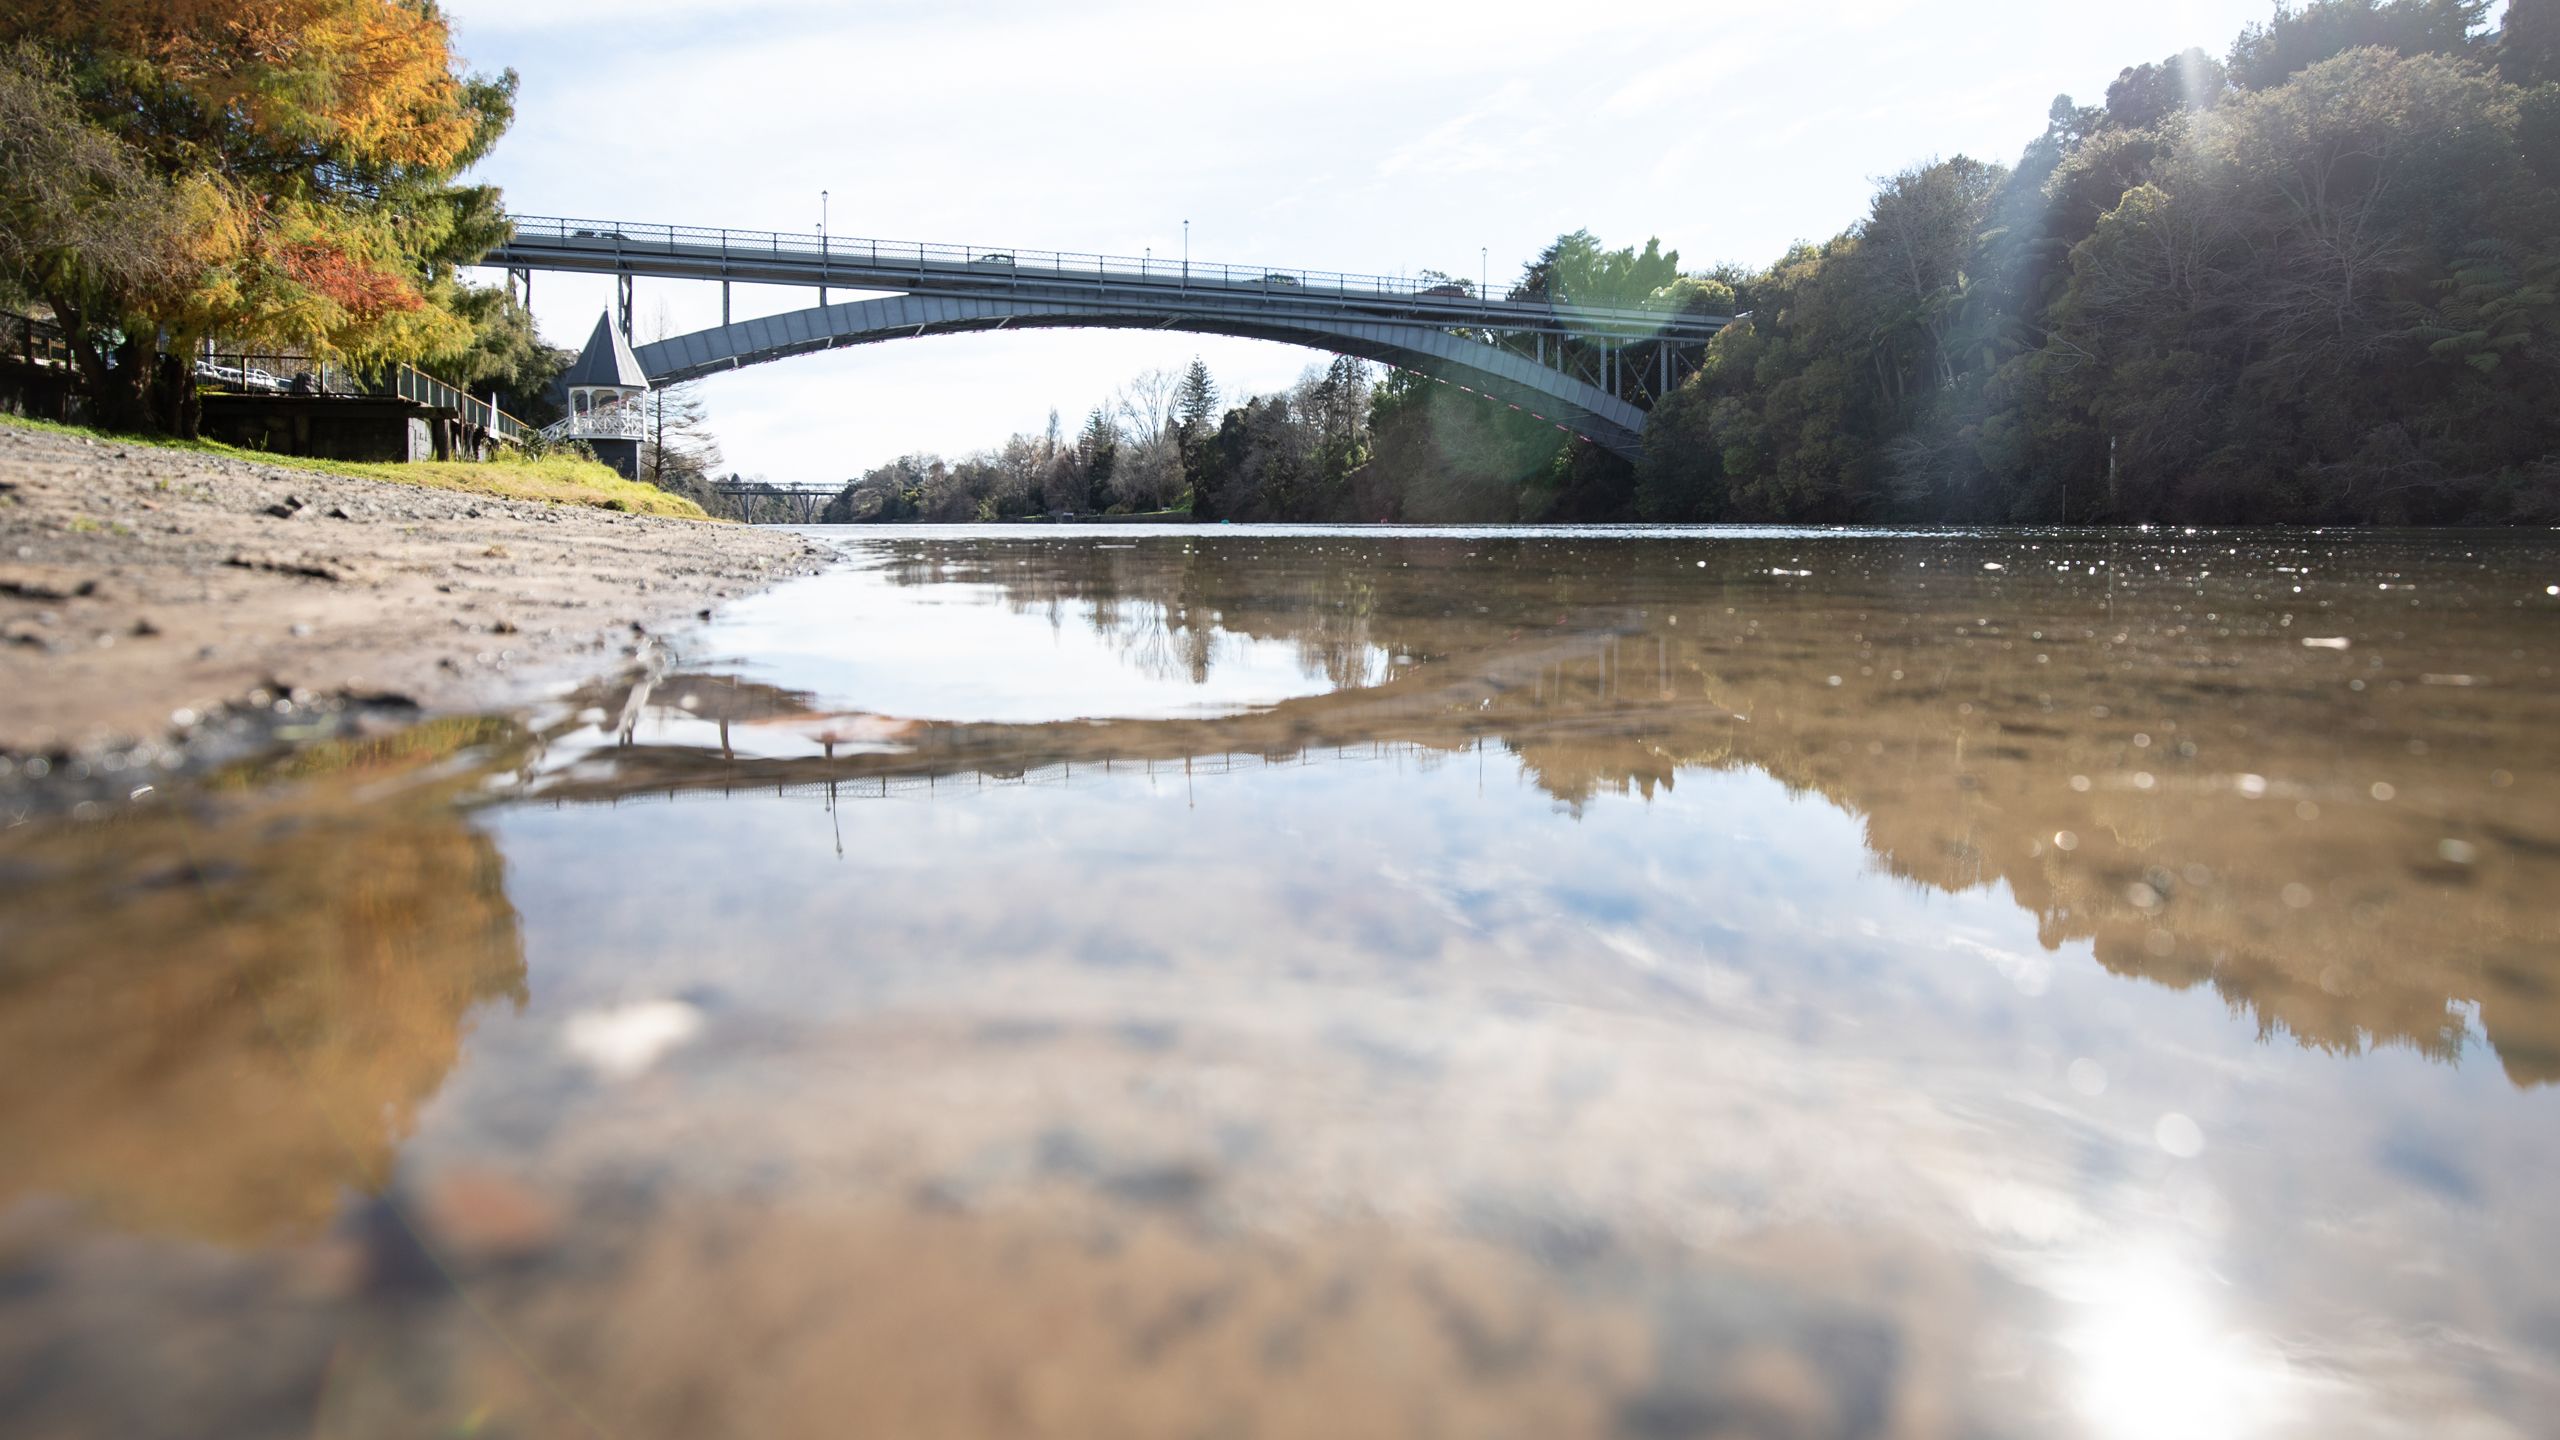
The Waikato river at Bridge Street, Hamilton
The Waikato river at Bridge Street, Hamilton

No-one will get away with it forever. If the Council’s proposed plan change 1 emerges through the appeals largely in one piece, change is coming for approximately 10,000 properties and more than a million hectares of land in the Waikato and Waipā River catchments.
What leaves their properties and makes its way into the river will be under scrutiny.
The council has selected four indicators as reflective of river health. The four horsemen of the river apocalypse are: sediment, bacteria such as E.coli, nitrogen and phosphorus.
Nitrogen is singled out, with farms and commercial vegetable producers required to estimate how much nitrogen is leaching from their properties. They’re then placed into a low, moderate, or high-leaching category. Properties with high leaching rates need to “significantly” reduce these over time, although the plan doesn’t specify by how much.
Waikato Regional Council’s science manager Dr Mike Scarsbrook says the goal is to reduce intensive land use and, “the nitrogen leaching loss rate is an indicator of that land use intensity”.
In general, future resource consents to change the way the land is used to something more intensive, won’t be granted.
Farm Environment Plans play a big part in the council’s plan change. These identify areas of a farm which might be at high risk for nutrient loss, or adding bacteria or sediment to fresh water, and look at ways to tackle the problem.
“If we understand what people are doing now, and the gap between current practice and good practice, we'll be able to understand well how far we can get by driving behaviour versus to what extent we need to change land use within the catchment.”
As well as the 80-year targets, 10-year targets have been set, and if they aren’t met, he says the next version of the plan, “may have to step up controls of certain things”.
A spanner in the works is finding an effective tool to model nitrogen leaching. The one plan change 1 originally foresaw doing the job - Overseer - has since been deemed unfit for purpose.
Federated Farmers group manager of regional policy Dr Paul Le Miere says the scathing Overseer review is a “fundamental problem” for the plan change, but the group is happy with the overall framework of the plan, bar some minimum standards it’s appealed.
A grass roots group of farmers who formed in reaction to the plan change, Farmers for Positive Change, is also onboard with the plan change. Chairperson Rick Burke says there are some “little things” which need more discussion, “but we’re pretty happy with the way it landed”.
One person who’s not happy is water scientist Dr Adam Canning.
He was in the beige hotel conference room when nitrogen targets for parts of the river were changed from 350 mg/m3 to 500.
Canning was there with a colleague to represent Fish & Game. There were three experts from the Department of Conservation, nine experts from industry groups and six from council-related interests.
Vested interests got their air-time, he says, but forget about the general public
“They [the public] are not the ones with the money paying for experts, paying for lawyers to go in there and lobby their case. There's nobody in that expert caucusing room just there purely representing the general public views.”

Initially nitrogen targets for the lower part of the river called for a reduction of 40 to 50 percent, which Canning says was ambitious and why the 80-year timeframe was fair. These were changed to an 11 to 24 percent reduction which he says “effectively means the status quo”.

He thinks part of the reason there was so much pushback on the nitrogen level is land values are often linked to how much nitrogen you can leach. The more you’re allowed to leach, the more intensively you can use the land.
The process also needs to be improved, he says, so what the community wants for the river is given more weight.
Will the length of the river be swimmable and safe to take food from in 80 years time?
“No, not at all,” says Canning.

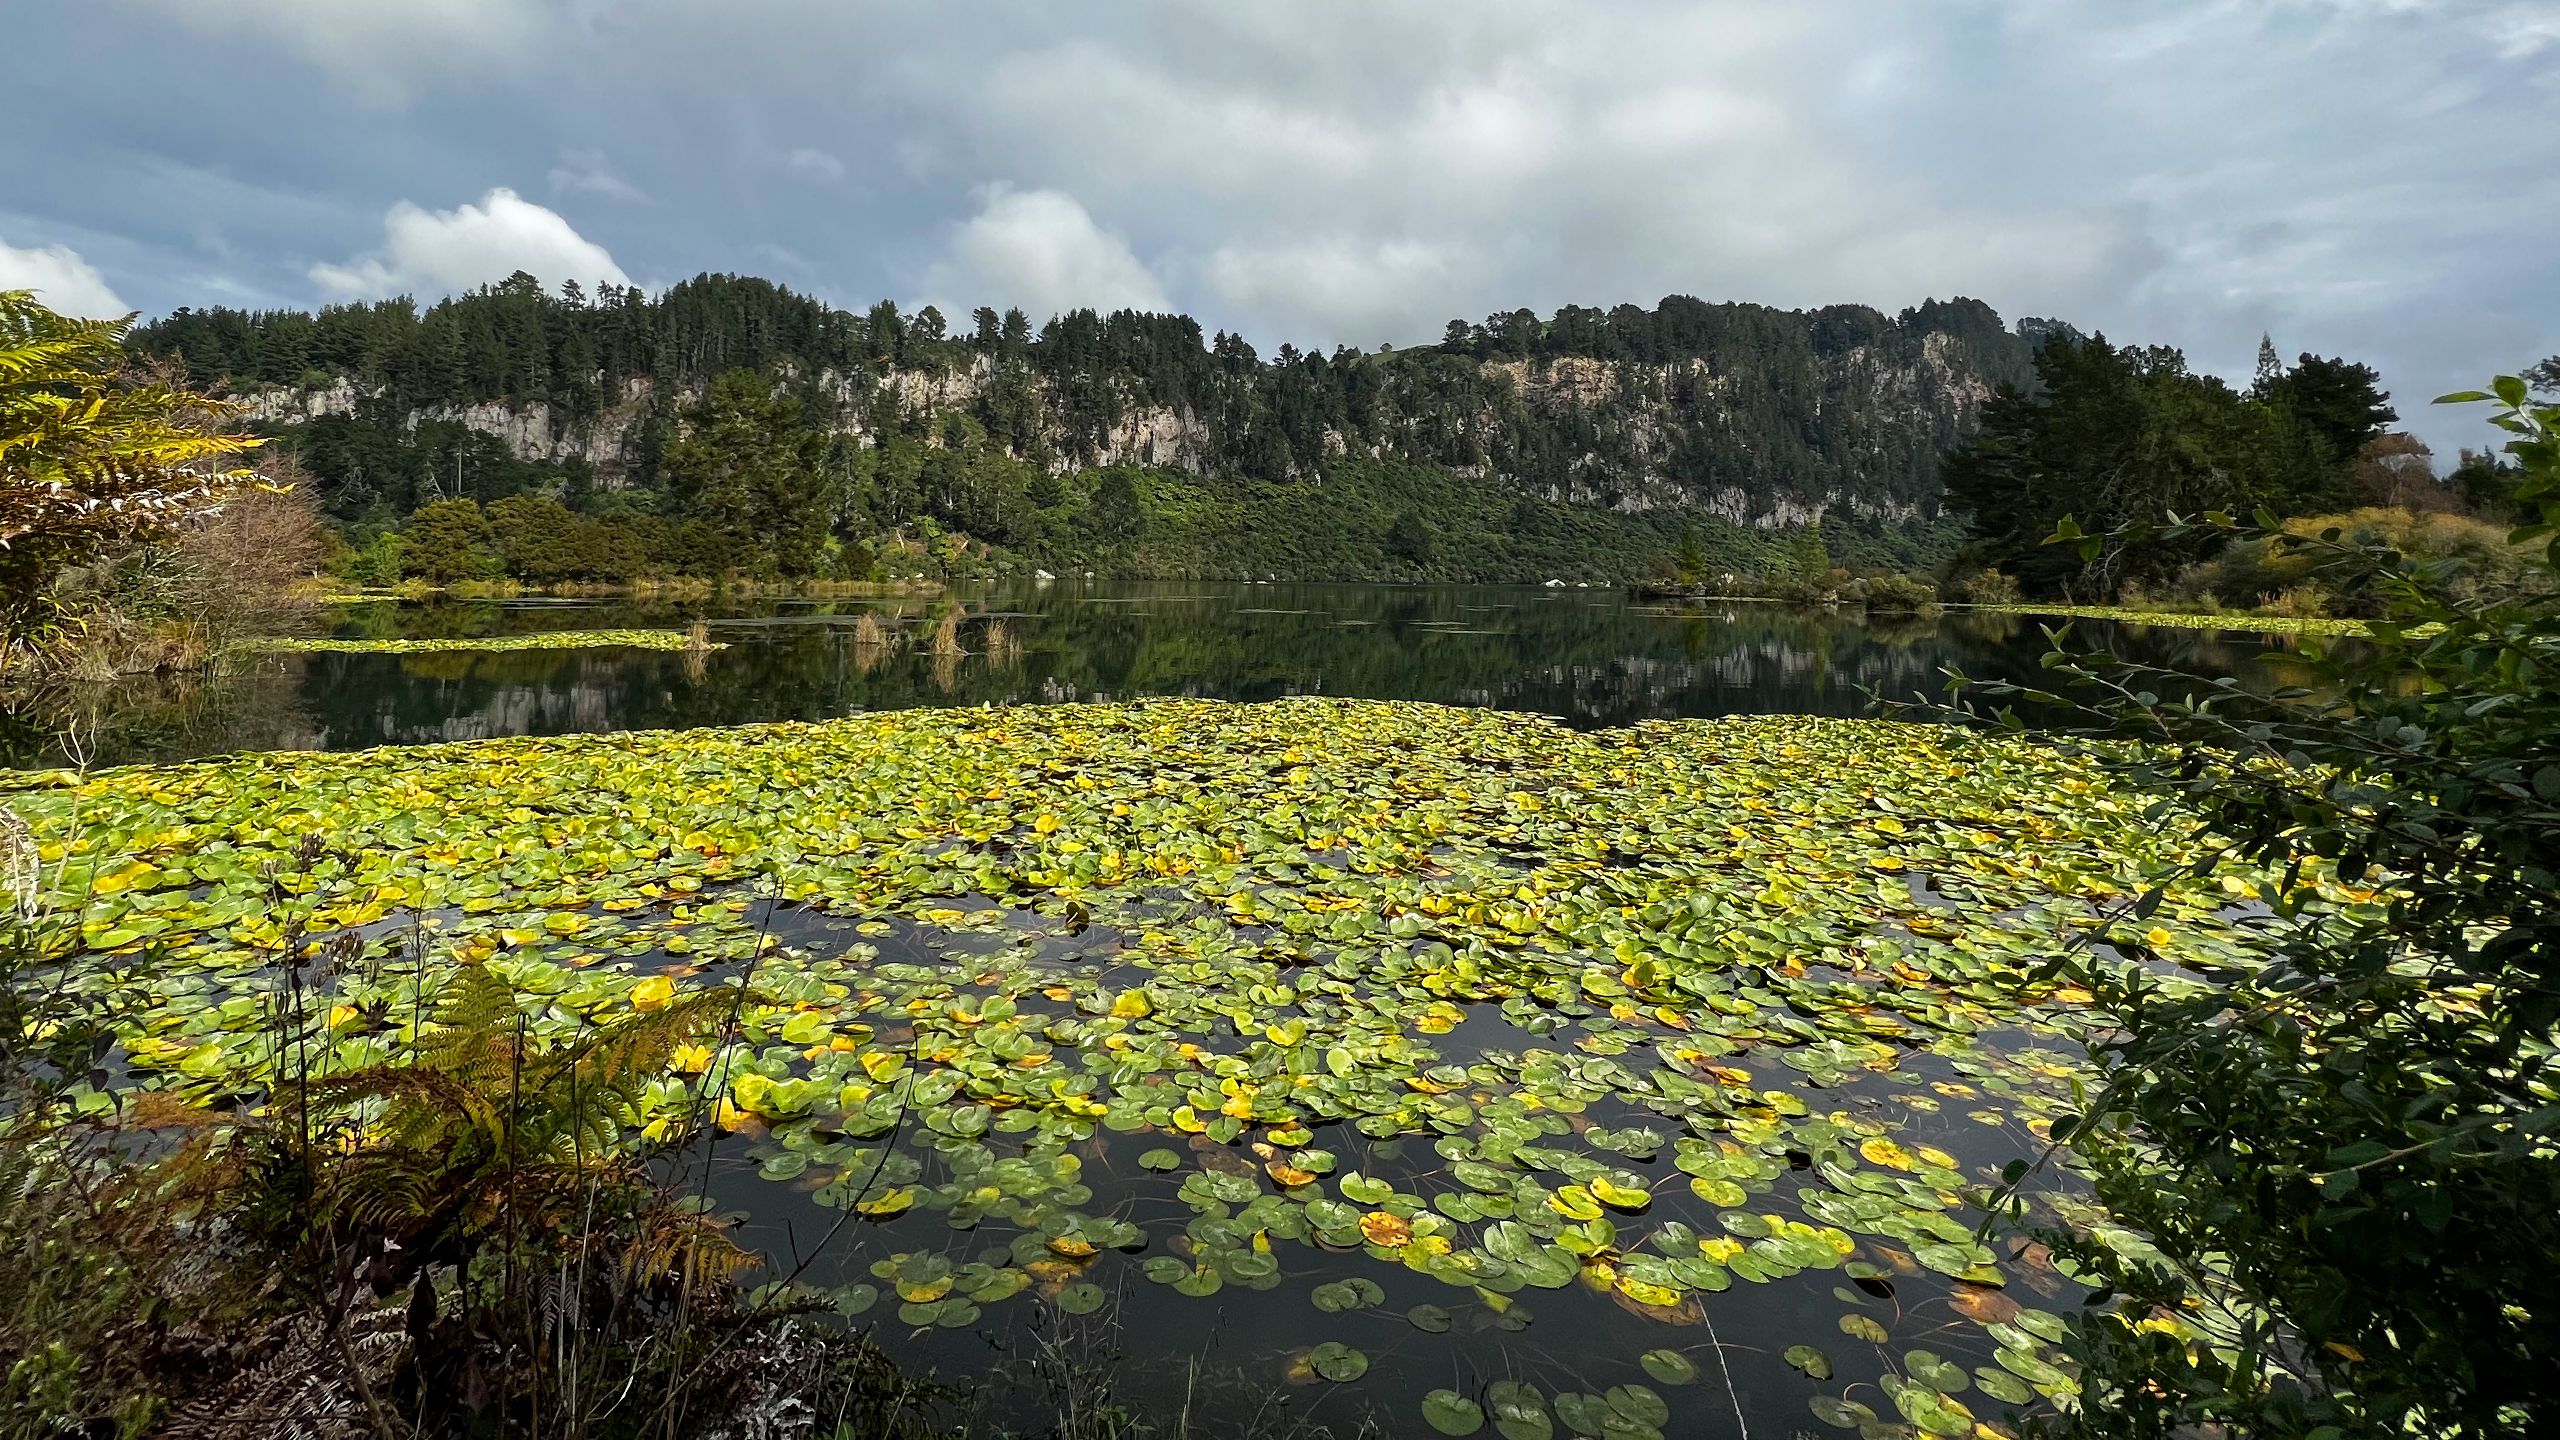
Nestled between two dams at the Taupō end of the Waikato River is Lake Whakamaru’s picturesque MiCamp. Cliffs flank one side of the lake and the camp sits on an island in the middle, connected to the lake’s edge by a causeway.
Before the dams were built the river flowed at a high rate through a narrow area. Now, the flooded portion of the river, referred to as Lake Whakamaru, has a lazy, slow current.
When the water’s warm, church and school groups swim, kayak and build rafts at the lake camp. A pontoon bobs just offshore.
“In summer, man, those kids love it. They're out on the pontoon doing manus [bombs],” says Keziah Muir.

She and her husband Chris have managed the camp for four years. Last summer a blue-green algae bloom meant popping a manu was off-limits for a month.
“They weren’t even allowed to go kayaking,” she says.
The water looked okay, but somewhere, either above or below them, a sample had shown potentially toxic blue-green algae. The health warning stating a risk of rashes, stomach upsets, asthma and hayfever attacks as well as possible neurological effects, added up to water too minging to manu in.
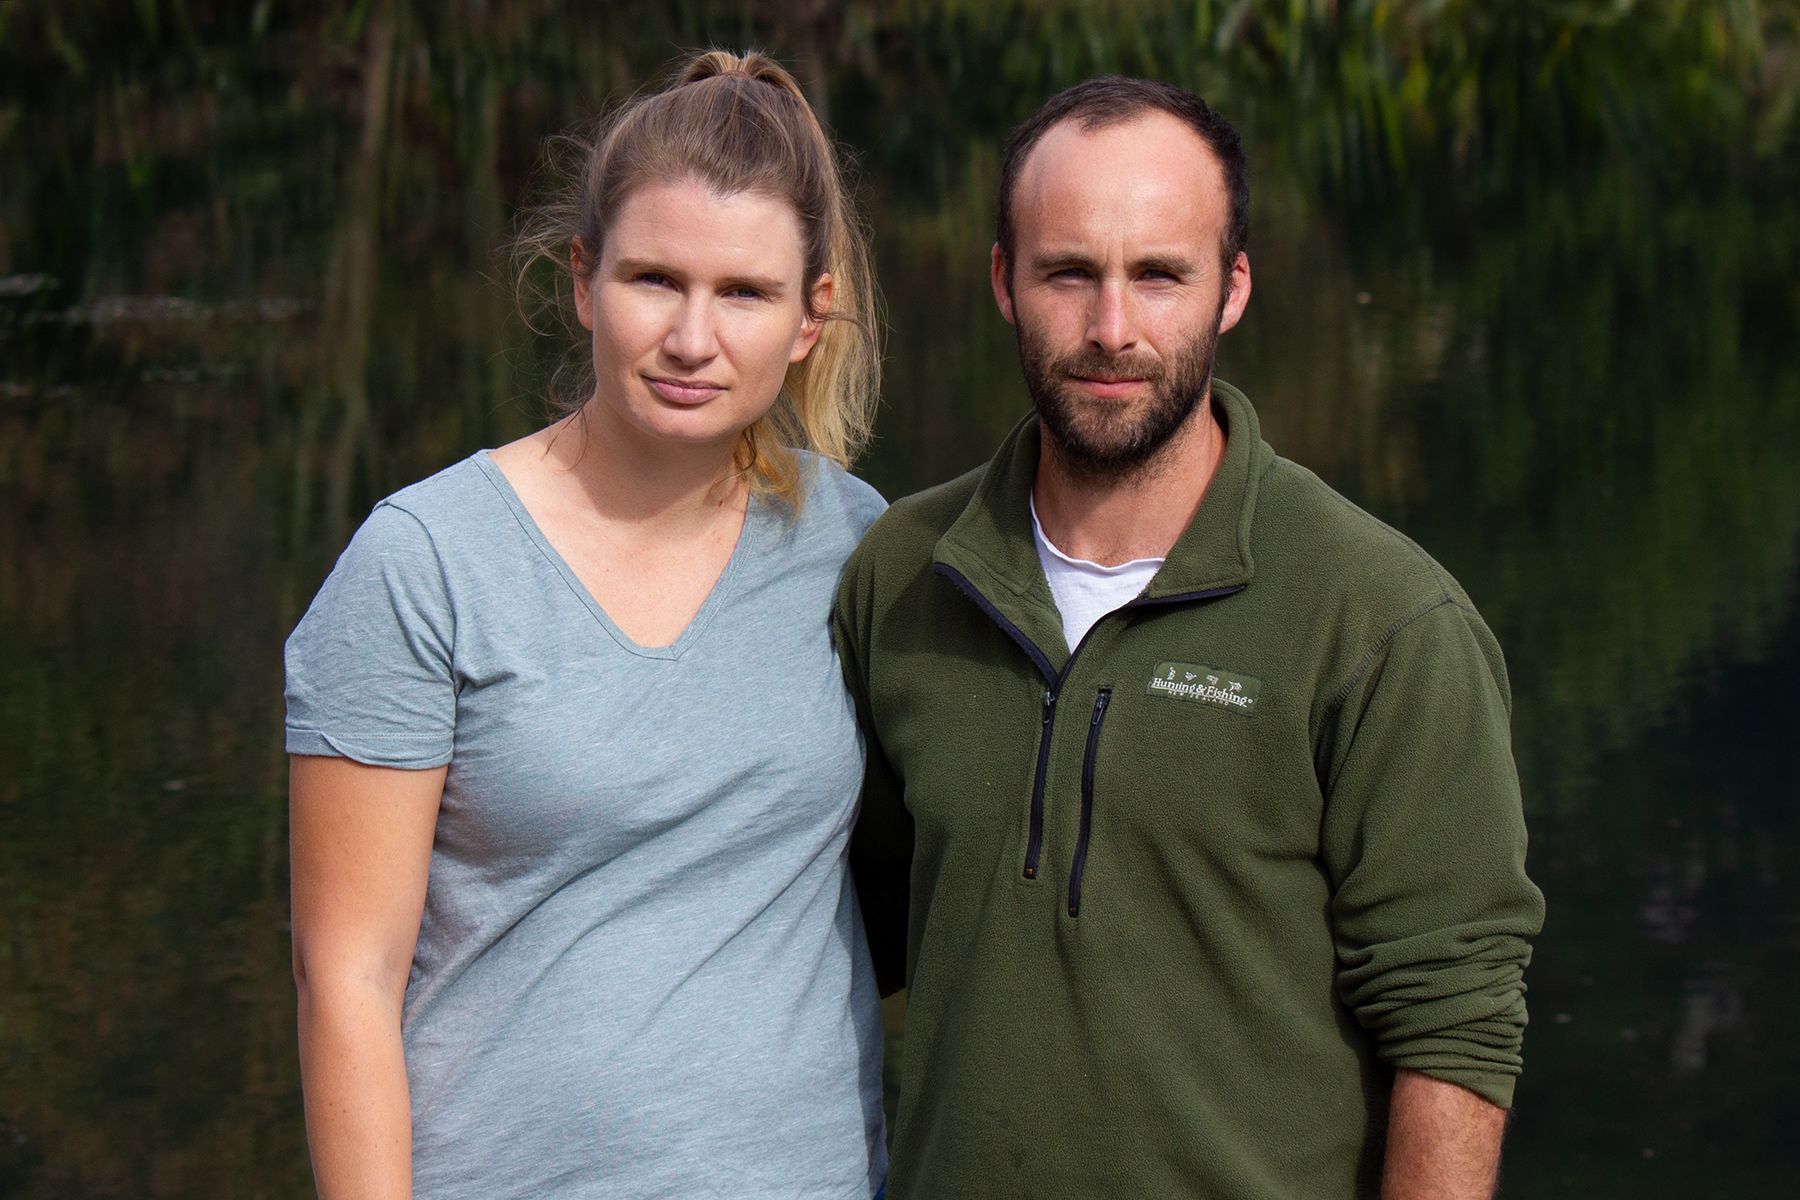
Keziah and Chris Muir
Keziah and Chris Muir
The river lake is at the end of the Taupō end of the river, which is supposed to have lower levels of nutrients in it, but the Muirs say even at the pristine end of the river, there are problems which point to high levels.
Stand on the banks of the island for a few minutes and rafts of lake weed slowly drift by. If the raft hits a snag, it starts banking up. Campers think the weed is gross, she says, but it also poses a safety risk.
“Weed definitely hinders us a lot when you are kayaking and swimming, because you can get tangled up in there.”
In the camp’s winter off-season the weed isn’t too bad, come summer when the camp is in full swing, it’s a different story.
“Depending on the summer, and how hot it's gotten, it can sometimes get to 70 to 80 percent coverage here. It's pretty disgusting.”
The lake weed and water lilies, which are also choking up parts of the lake where the current is sluggish, get sprayed once a year by power company Mercury who run the dams on either end of the lake.
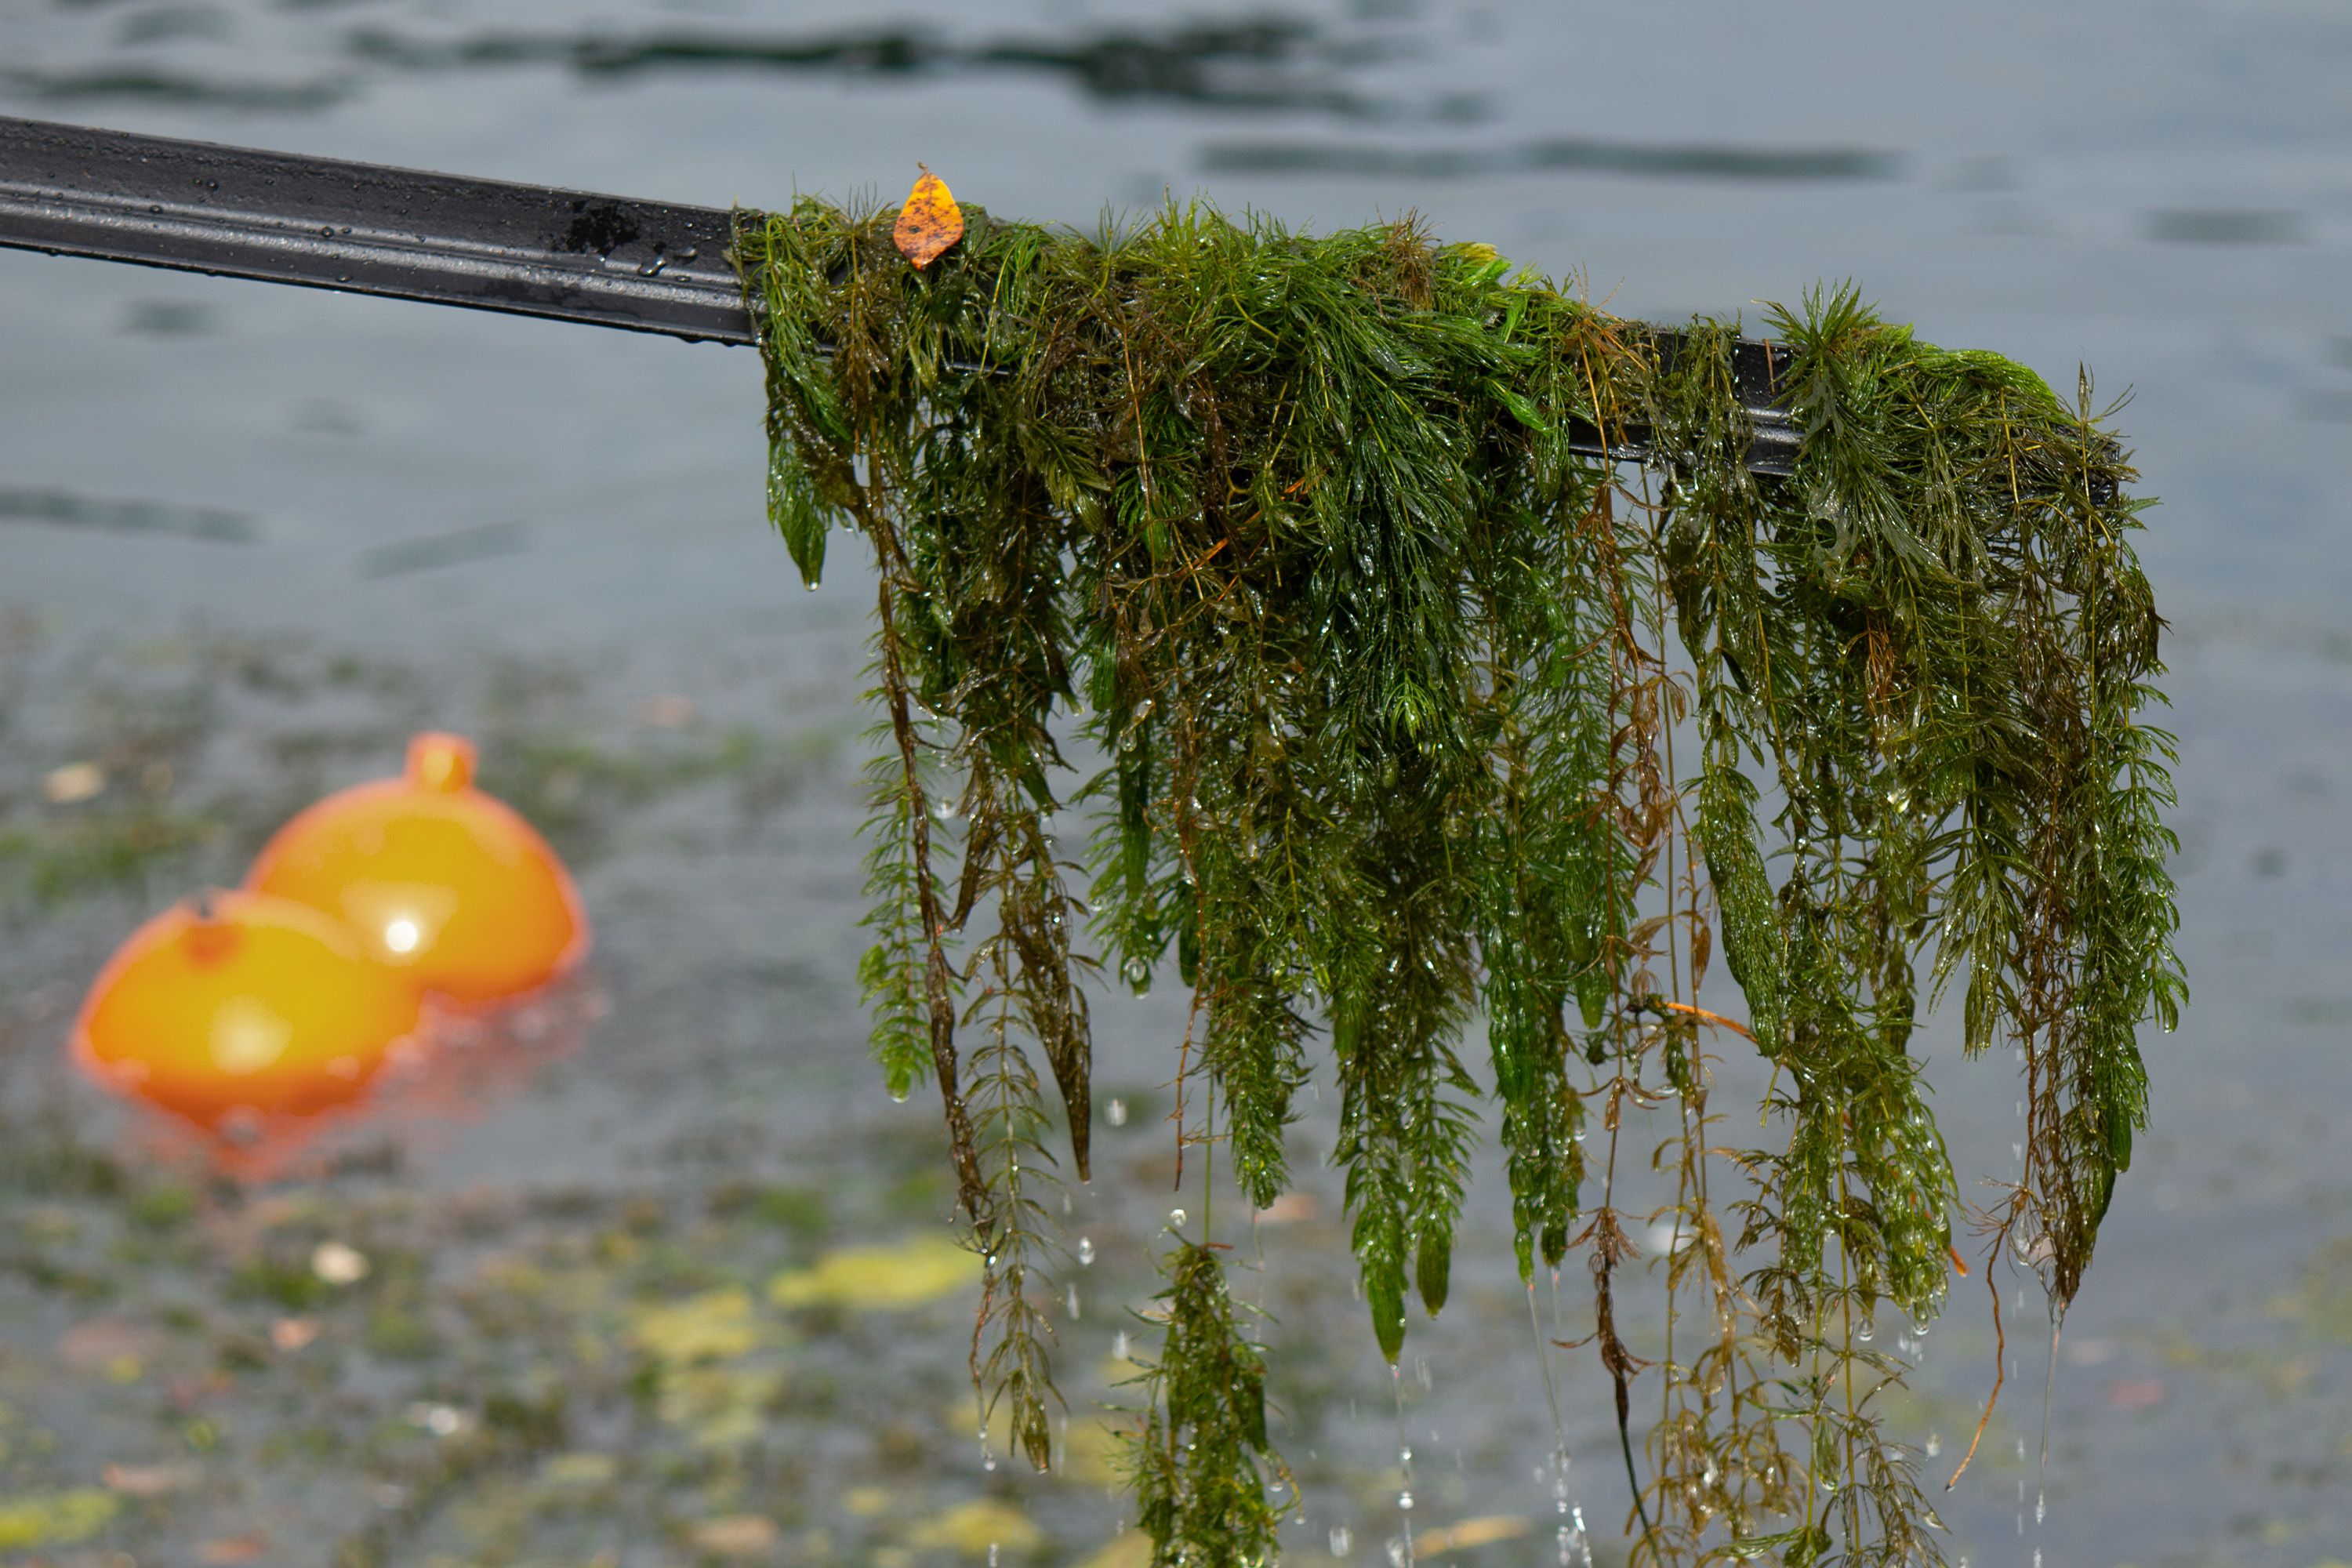
Rafts of river weed drift down the lake
Rafts of river weed drift down the lake
The Muirs have noticed other changes. Chris’s parents ran the camp when he was a child, so he’s known the lake for decades, says Keziah.
“When Chris was a young boy, there was freshwater crayfish - kōura - in the lake. Whereas when we came, we could not see a single one. Normally, you can see the little red eyes at night when you shine a torch, but you cannot see a single one.”
The Muirs hope soon they’ll know more about what’s happening in the lake. Today Chris climbed one of the taller trees on the island, stringing cables to a 3 metre high communications pole connected to a water monitoring unit.
The pole will transmit results from the monitoring unit so it can be viewed in real-time on a website. Once it’s up and running, Chris plans to include it in what children learn about when they visit the camp. “I think it's a really good idea to tell them actually what we're doing and just the potential of being able to improve our lake.”
Among other things, the UV spectrometer in the monitoring unit detects chlorophyll, nitrate, and drivers for the growth of weed and algae.
The installation of the unit is thanks to Rob Dexter from DCM Process Control. His company specialises in water monitoring and his thirst for information has earned him a nickname.

Dexter installed the unit at his own cost. It’s one of four he’s put up and down the river, sweet-talking local landowners into allowing him access, and footing the bill for the small amount of electricity they use.
This is very different to how the councils usually monitor the river. They take water samples from different locations once a month and analyse them. But what’s been happening in the river on all the other days of the month remains a mystery.
It’s this real-time monitoring which could be a gamechanger.
Dexter says data from a similar unit owned by Hamilton City Council showed one day and one week spikes of nitrates. These would be missed if the monthly sample wasn’t taken during the spike.
Hooking up several units can show whether what happens upstream impacts downstream readings.
A unit at Orakei Korako showed high nutrient readings for several days but these didn’t show up downstream at his unit at the Cambridge golf course.
“That tells us that the nutrients were taken up by the river system enroute.”
Dexter’s not an ecologist and doesn’t profess to know the answers to fixing the river, but he hopes the huge amounts of data the units collect will be useful to others. He’s providing it to the Waikato Regional Council.
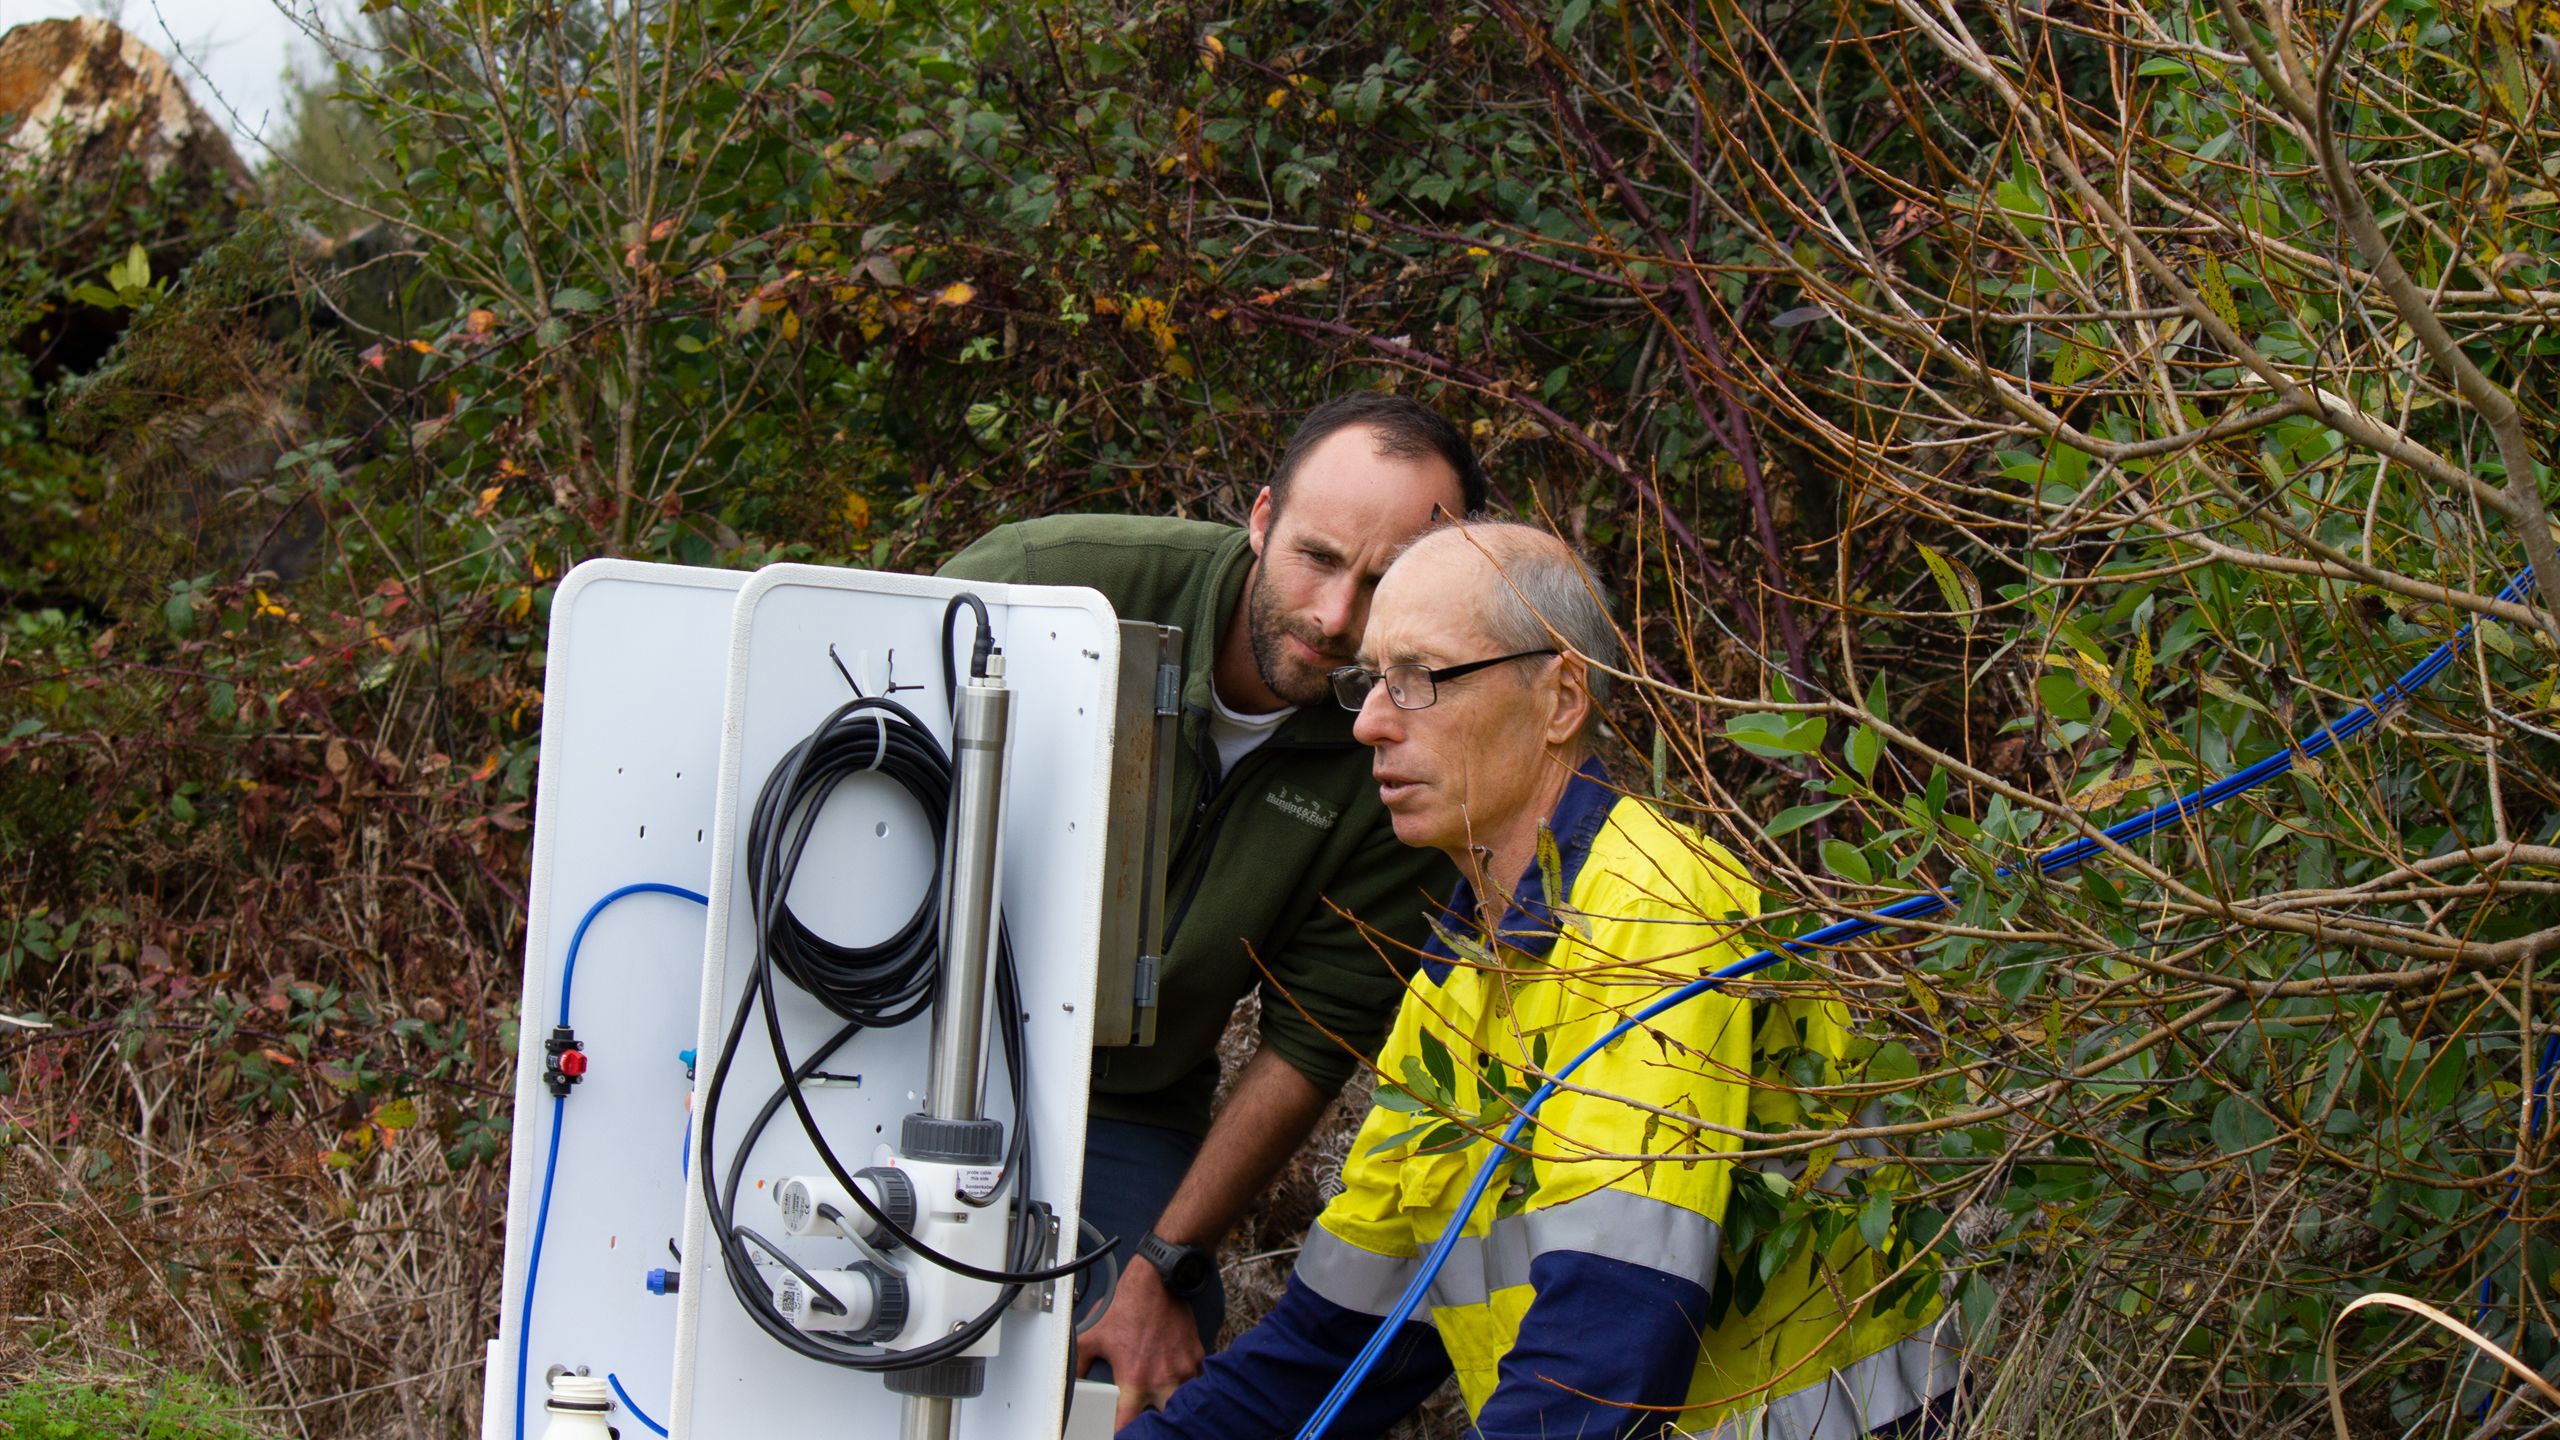

“By integrating the data sets gathered, Waikato Regional Council ecologists will be able to not only see how nutrient loads vary, but how the river ecology reacts to the changes.”
He says the data could be used to help model river conditions, similar to how weather is forecast.
“This will link cause and effect so we can make optimal decisions to improve river health."
He’d love to see data from the units validated and published online, so ecologists and the public can access it whenever they want. He’d also like to see more units installed.
Could better data help us make the river swimmable and safe for collecting food from?
“If you had the information to know what's creating the issues, and you put policies in place now, not in 20 or 30 years time, you certainly could,” he says.
If farmers can see what happens after they fertilise they’ll be able to make decisions which could save them money and benefit the river. Perhaps they will discover that using less fertiliser more frequently reduces leaching, or what soil temperature is optimal before putting fertiliser on to prevent leaching.
He likens it to figuring out the sweet spot of beer and pie consumption at a party.
“[What] if you ate one pie and a bit of salad and had two beers and enjoyed yourself, instead of having 15 beers, eating too many pies, and then throwing it up out the back?”

Work has forged ahead even while the regional council’s plan change has limped through the consultation process and sat with the Environment Court.
Drained farmland has been turned back into wetlands, whitebait spawning habitat has been restored, unproductive hill country has been planted with native plants, all thanks to funding from the Waikato River Authority.
In total the Authority has helped to fund the planting of more than 2 million natives, fencing of almost 400 km of waterways and restored 1756 hectares of land.
Tawera Nikau (Tainui) is one of the recipients of the funding. For the past seven years he’s led a restoration project at Lake Waikare. Its waters feed into a wetland and then flow into the Waikato River.
Lake Waikare has played a role in the lives of his whānau for generations.
Now algae blooms turn the water green or a pumpkin-flesh orange in summer, earning it the nickname Fanta Lake. The scientific name for the lake’s water quality is hypertrophic, the worst state possible. In these types of lakes, the frequent algae blooms use up all the oxygen, creating dead zones below the surface.
Nikau says the lowering of the lake in the 1960s as part of a flood control scheme sparked many of the issues they’re fighting today. Water doesn’t flush through the lake to clean it as it once did.
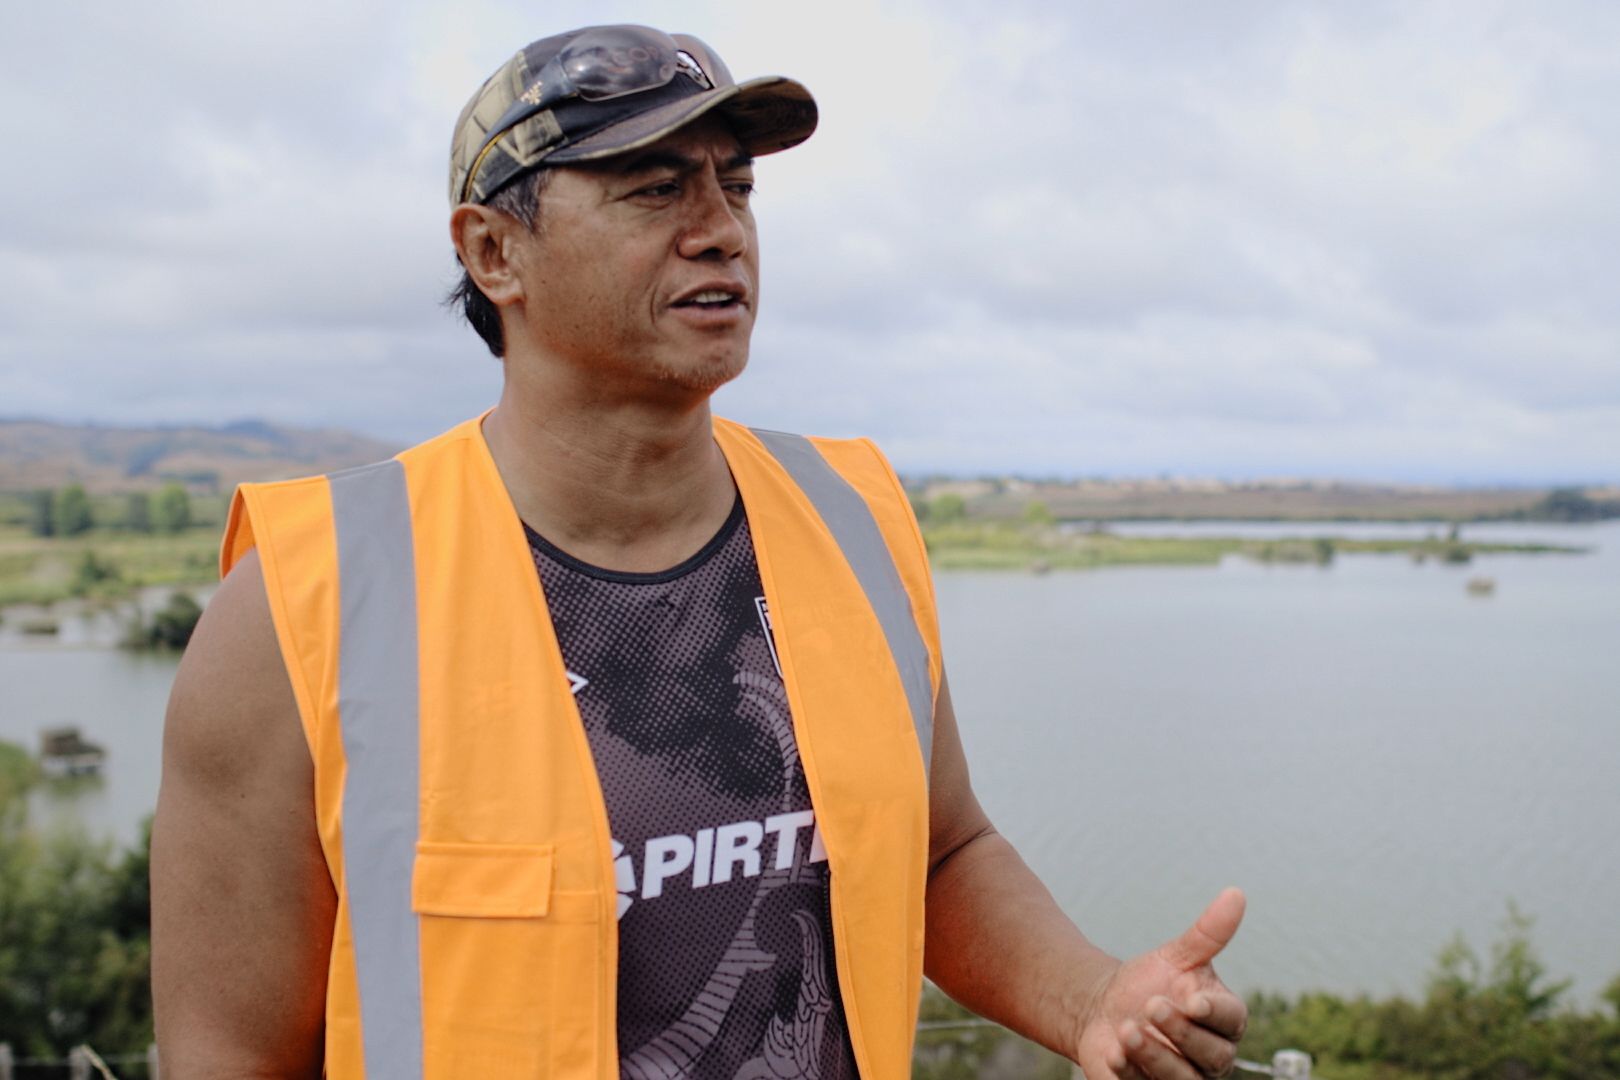
Tawera Nikau at Lake Waikare
Tawera Nikau at Lake Waikare
“All the nitrogen and phosphorus from fertiliser runs into the lake,” he says.
Nikau farms on the banks of the lake and as mana whenua and kaitiaki, he says the question was ‘how can we improve our own backyards?’
He says intensive dairying on one farm has given way to cropping, and another dairy farm recently purchased will likely transition to an organic dairy farm in the future.
Funding has helped with restoration of a wetland and riparian planting. So far 240,000 trees have been planted and there’s plans to plant another 800,000 and restore 35 ha of wetland over the next five years.
“So, it’s a long transition,” he says. “The great thing about that is that we've been able to get our kids, our tamariki and mokopuna, involved in that project.”
It took two or three generations for the lake to get to its current hypertrophic state and Nikau expects his children and grandchildren will need to carry on the work he’s started.
“Will it get back to what it was? Probably not, but I think there’s a genuine commitment from farmers, whānau, hapū, iwi to make things better.”

Data visualisation sources and notes:
1. Nitrogen and phosphorus tonnes per year in the Waikato River data source: Draft updates to Sources of nitrogen and phosphorus in the Waikato and Waipā Rivers, during 2011–2020, supplied by the Waikato Regional Council
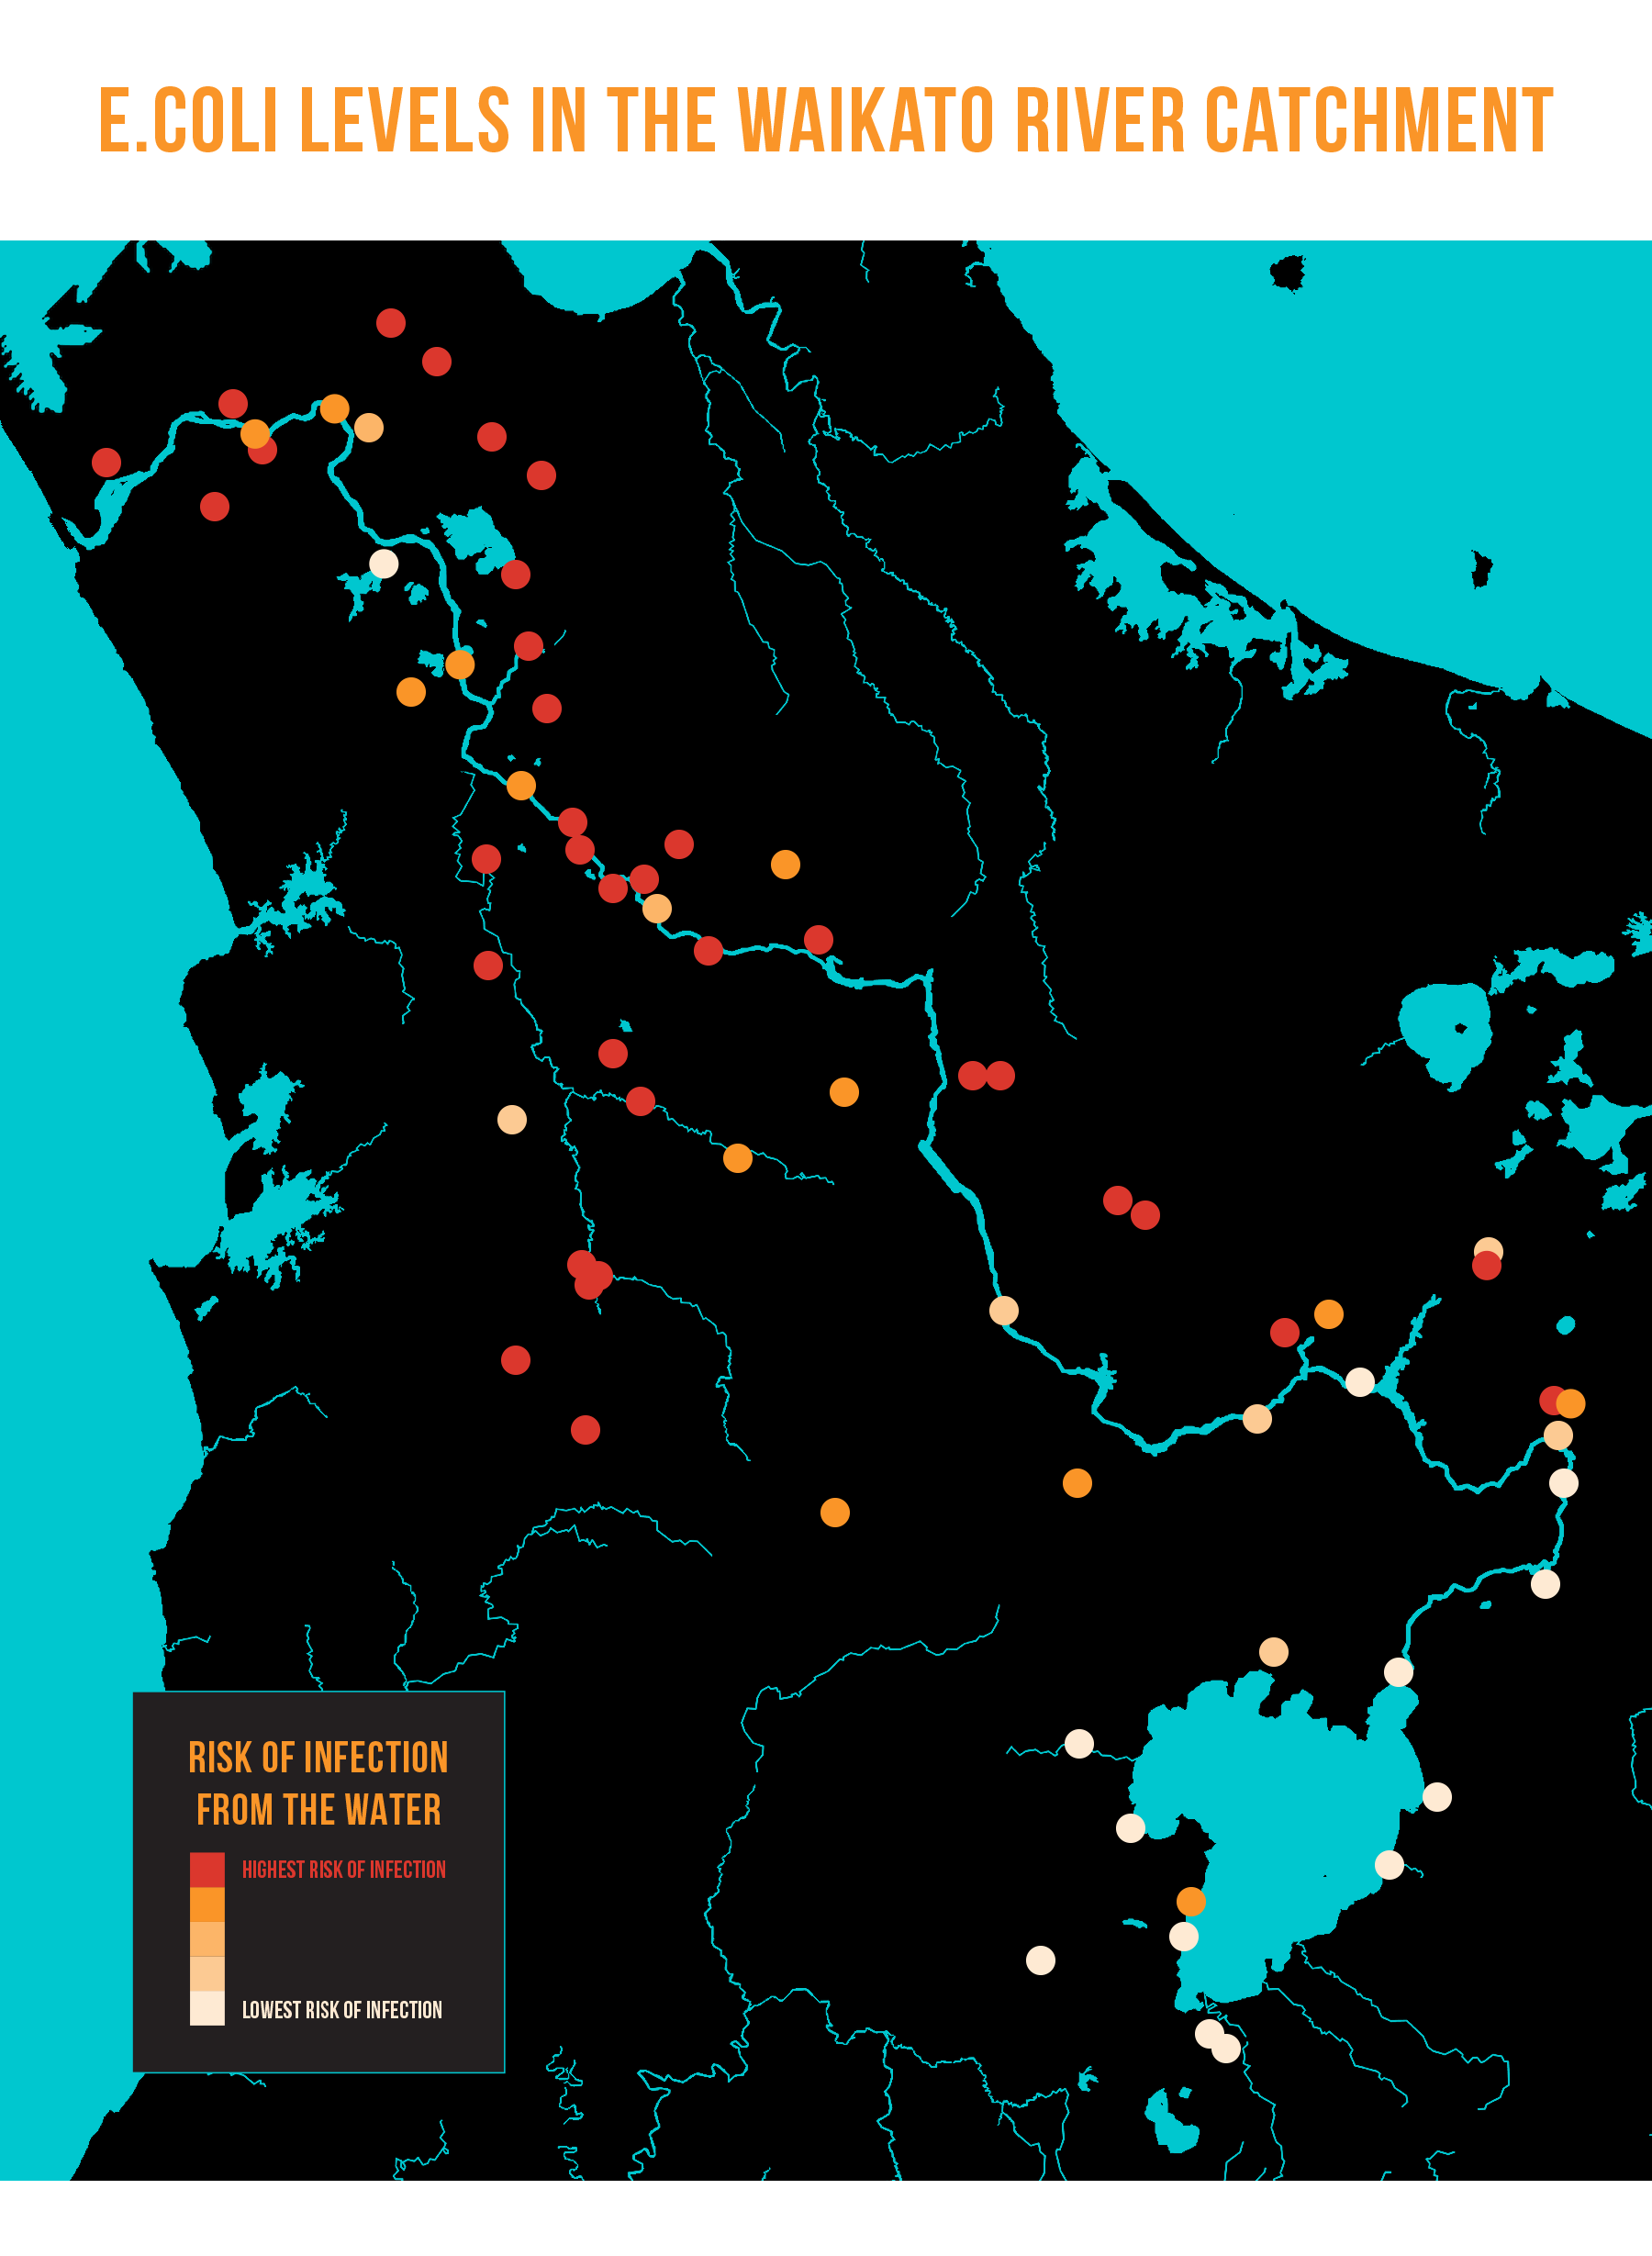
2. E.coli rankings data source: LAWA River water quality state and trend results (Sept 2021)
Ranking Key:
▋A: For at least half the time, the estimated risk is <1 in 1000 (0.1% risk). The predicted average infection risk is 1%.
▋ B: For at least half the time, the estimated risk is <1 in 1000 (0.1% risk). The predicted average infection risk is 2%.
▋C: For at least half the time, the estimated risk is <1 in 1000 (0.1% risk). The predicted average infection risk is 3%.
▋D: For 20-30% of the time, the estimated risk is >=50 in 1000 (>5% risk). The predicted average infection risk is >3%.
▋E: For more than 30% of the time, the estimated risk is >=50 in 1000 (>5% risk). The predicted average infection risk is >7%*.
3. Nitrogen current state and 2096 target data source: Proposed Waikato Regional Plan Change 1: Waikato and Waipā River Catchments
Current state is 2010 - 2014 TN median mg/3
